March 20, 2026 a 03:32 pm


ADP: Dividend Analysis - Automatic Data Processing, Inc.
Automatic Data Processing, Inc. presents a consistent and reliable dividend profile. With over 44 years of uninterrupted dividend history and a current yield of 3.11%, ADP stands as a steadfast option for income-focused investors. However, the moderate growth rate prompts for vigilance in maintaining future competitive advantages.
📊 Overview
The detailed analysis of ADP's dividend profile reveals the company's commitment to its shareholders. The following table provides a concise summary:
| Attribute | Details |
|---|---|
| Sector | Information Technology |
| Dividend yield | 3.11 % |
| Current dividend per share | 5.89 USD |
| Dividend history | 44 years |
| Last cut or suspension | None |
📉 Dividend History
ADP boasts an impressive dividend history, indicating its steadfast commitment to returning capital to shareholders. The consistent dividends for over four decades emphasize stability and trustworthiness in its financial operations.
| Year | Dividend per Share (USD) |
|---|---|
| 2026 | 1.7 |
| 2025 | 6.32 |
| 2024 | 5.74 |
| 2023 | 5.15 |
| 2022 | 4.37 |
📈 Dividend Growth
The growth of dividends is crucial for investors seeking increasing income over time. With a stable growth in dividends over both 3 and 5 years, ADP showcases its financial agility and sustainable growth outlook.
| Time | Growth |
|---|---|
| 3 years | 13.09 % |
| 5 years | 11.54 % |
The average dividend growth is 11.54 % over 5 years. This shows moderate but steady dividend growth.
✅ Payout Ratio
The payout ratio indicates ADP's ability to sustain its dividend payments from earnings and cash flow, a critical metric for assessing dividend sustainability.
| Key figure | Ratio |
|---|---|
| EPS-based | 56.18 % |
| Free cash flow-based | 51.85 % |
The EPS payout ratio of 56.18% and FCF payout ratio of 51.85% illustrate a balanced cash distribution strategy, indicating the dividends are well-covered by the company’s earnings and cash flow.
💸 Cashflow & Capital Efficiency
The analysis of cash flow and capital efficiency metrics provides insights into the stability of ADP's operations and its strategic financial allocations. Here's how these financial metrics have evolved:
| Metric | 2023 | 2024 | 2025 |
|---|---|---|---|
| Free Cash Flow Yield | 5.37% | 3.71% | 3.80% |
| Earnings Yield | 4.96% | 3.88% | 3.25% |
| CAPEX to Operating Cash Flow | 3.03% | 13.55% | 3.41% |
| Stock-based Compensation to Revenue | 0.92% | 1.27% | 1.29% |
| Free Cash Flow / Operating Cash Flow Ratio | 96.58% | 86.45% | 96.58% |
ADP's stable free cash flow metrics combined with efficient capital spending indicate robust underlying business efficiency, paving the way for sustainable shareholder returns.
🔍 Balance Sheet & Leverage Analysis
The balance sheet and leverage analysis highlights ADP's financial health and its capability to meet long-term obligations.
| Metric | 2023 | 2024 | 2025 |
|---|---|---|---|
| Debt-to-Equity | 1.46 | 0.81 | 1.46 |
| Debt-to-Assets | 0.17 | 0.07 | 0.17 |
| Debt-to-Capital | 0.59 | 0.45 | 0.59 |
| Net Debt to EBITDA | 0.34 | 0.14 | 0.92 |
| Current Ratio | 1.03 | 1.01 | 1.05 |
| Quick Ratio | 1.05 | 1.01 | 1.05 |
| Financial Leverage | 8.62 | 11.95 | 8.62 |
ADP's current ratios and leverage indicators demonstrate a solid balance sheet with manageable debt levels, albeit with room for reduced leverage to enhance financial flexibility.
📈 Fundamental Strength & Profitability
Assessing profitability and fundamental health, ADP displays strong performance across essential financial metrics.
| Metric | 2023 | 2024 | 2025 |
|---|---|---|---|
| Return on Equity | 68.28% | 82.51% | 65.93% |
| Return on Assets | 5.00% | 6.90% | 7.64% |
| Net Profit Margin | 19.94% | 19.54% | 19.84% |
| EBIT Margin | 27.99% | 27.28% | 27.99% |
| EBITDA Margin | 30.36% | 30.20% | 30.36% |
| Gross Margin | 50.84% | 49.94% | 50.84% |
| Research & Development to Revenue | 4.83% | 4.98% | 4.81% |
ADP's robust margins and high return ratios signify a company with strong competitive advantages, effectively converting revenue into profit, thus magnifying shareholder returns.
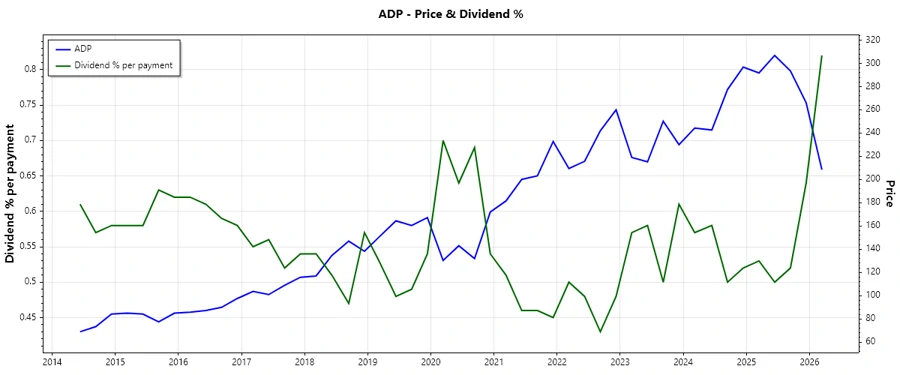
📈 Price Development
🏆 Dividend Scoring System
| Category | Score | Indicator |
|---|---|---|
| Dividend yield | 4 | |
| Dividend Stability | 5 | |
| Dividend growth | 4 | |
| Payout ratio | 3 | |
| Financial stability | 4 | |
| Dividend continuity | 5 | |
| Cashflow Coverage | 4 | |
| Balance Sheet Quality | 4 |
Total Score: 33/40
⭐ Rating
Automatic Data Processing, Inc. holds a commendable standing as a dividend-paying entity with consistent performance and reliable yields. Even though dividend growth is moderate, the financial metrics are robust, suggesting a stable investment for those seeking income stability. However, potential investors should continually evaluate the market dynamics and internal strategies for any evolving risks.