
July 19, 2026 a 04:03 am
ADI: Trend and Support & Resistance Analysis - Analog Devices, Inc.
Analog Devices, Inc. (ADI) has demonstrated resilience and innovation in a dynamic technology sphere. With a diverse portfolio covering data converters, power management devices, and RF ICs, ADI is well-positioned to capitalize on growth across automotive, telecommunications, and industrial markets. The stock's recent performance reveals insights into underlying market sentiment and potential future movements.
Trend Analysis
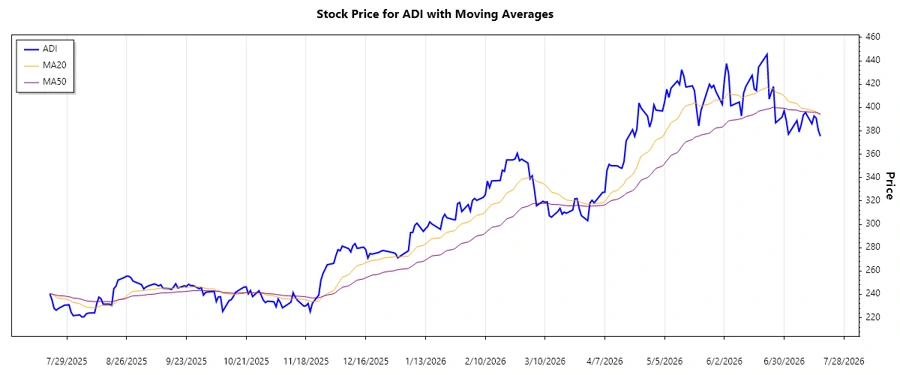
The trend analysis of ADI stock shows dynamics indicative of current market conditions. The Exponential Moving Averages (EMA) over 20 and 50 periods highlight the trend:
| Date | Closing Price | Trend |
|---|---|---|
| 2026-07-17 | 375.36 | ⚖️ |
| 2026-07-16 | 380.53 | ⚖️ |
| 2026-07-15 | 390.96 | ⚖️ |
| 2026-07-14 | 392.75 | ⚖️ |
| 2026-07-13 | 386.01 | ⚖️ |
| 2026-07-10 | 395.65 | ⚖️ |
| 2026-07-09 | 393.64 | ⚖️ |
The EMAs indicate a stable trend over the recent period, suggesting a neutral sentiment in the market. This can often imply a phase of consolidation.
Support- and Resistance
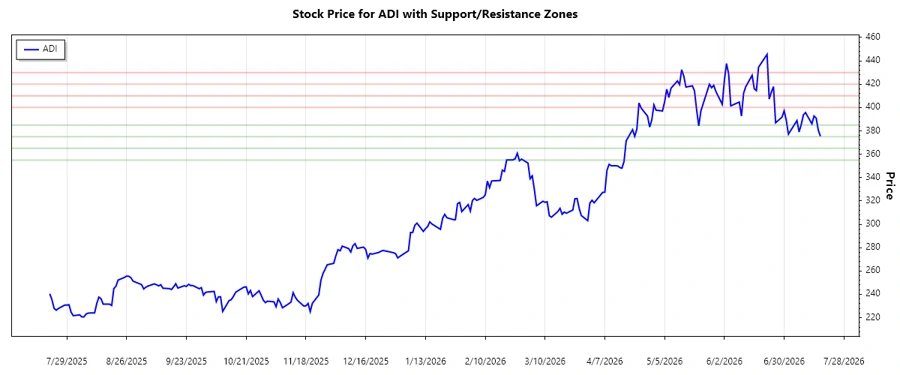
The data reveals key support and resistance zones, fundamental for decision-making:
| Zone Type | From | To |
|---|---|---|
| Support Zone 1 | 355.00 | 365.00 |
| Support Zone 2 | 375.00 | 385.00 |
| Resistance Zone 1 | 400.00 | 410.00 |
| Resistance Zone 2 | 420.00 | 430.00 |
The current price is within the second support zone, indicating potential price support at current levels. This hints at a buying interest in the market.
Conclusion
The technical analysis of ADI indicates a mixed but stable sentiment in recent trading activity. While price levels are currently within a crucial support zone, suggesting market interest at current valuations, the established resistance zones highlight potential levels where the price may encounter selling pressure. Analysts should consider these dynamics alongside market news and company developments. This framework helps investors evaluate potential entry or exit points in relation to broader market movements.
Smart Data Insight
Master the Perfect Entry & Exit for this Stock
Don't leave your profits to chance. Historically, this stock follows specific seasonal patterns that institutional traders use to maximize returns.
- ✅ Identify the "Golden Buying Window"
- ✅ Avoid high-risk correction cycles
- ✅ Backtested data from the last 20+ years