March 19, 2026 a 02:03 pm


ADI: Trend and Support & Resistance Analysis - Analog Devices, Inc.
Analog Devices, Inc. is a leading semiconductor company specializing in innovative integrated circuits. With a broad clientele across industrial, automotive, and communications sectors, ADI consistently offers cutting-edge solutions. Our latest technical analysis reveals key insights into its stock movement and potential for investors.
Trend Analysis
| Date | Closing Price | Trend |
|---|---|---|
| 2026-03-19 | $306.65 | ⚖️ Seitwärtstrend |
| 2026-03-18 | $308.59 | ⚖️ Seitwärtstrend |
| 2026-03-17 | $313.66 | ⚖️ Seitwärtstrend |
| 2026-03-16 | $310.92 | ⚖️ Seitwärtstrend |
| 2026-03-13 | $306.07 | ⚖️ Seitwärtstrend |
| 2026-03-12 | $307.27 | ⚖️ Seitwärtstrend |
| 2026-03-11 | $319.22 | ⚖️ Seitwärtstrend |
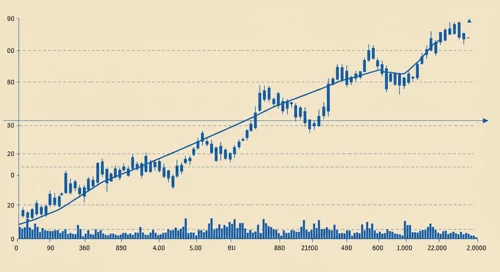
The EMA20 and EMA50 analysis suggests a neutral trend, showing that the stock of Analog Devices, Inc. is in a consolidation phase. Technical traders should watch for a breakout.
Support and Resistance
| Zone | From | To |
|---|---|---|
| Resistance Zone 1 | $320 | $329 |
| Resistance Zone 2 | $341 | $355 |
| Support Zone 1 | $273 | $277 |
| Support Zone 2 | $292 | $296 |
Currently, the stock is trading near a resistance zone. A break above this could indicate a further rise in stock price, while a rejection could lead to revisiting support levels.
Conclusion
Analog Devices, Inc. stands at a pivotal moment with its stock price consolidating between significant support and resistance levels. A breakout could entice bullish investors, yet cautious traders will seek confirmation in either direction. The global reach and diversified client base solidify ADI's standing but competition in the semiconductor sector remains fierce. For investors, the current scenario presents both opportunities and risks tied closely to market and sector dynamics.