March 02, 2026 a 09:03 amUm die geforderten Analysen durchzuführen, verwende ich ein strukturiertes und standardisiertes Format.
**Technical Analysis for Analog Devices, Inc. (ADI)**
ADI: Trend and Support & Resistance Analysis - Analog Devices, Inc.
Analog Devices, Inc. has demonstrated consistent growth in its stock value over the past months, with notable support and resistance levels evident in the data. Analysts are optimistic about the company’s technological advancements and market penetration, reflected in positive stock price trends. However, this optimism is tempered with cautious analysis of current market conditions which may influence future price movements.
Trend Analysis
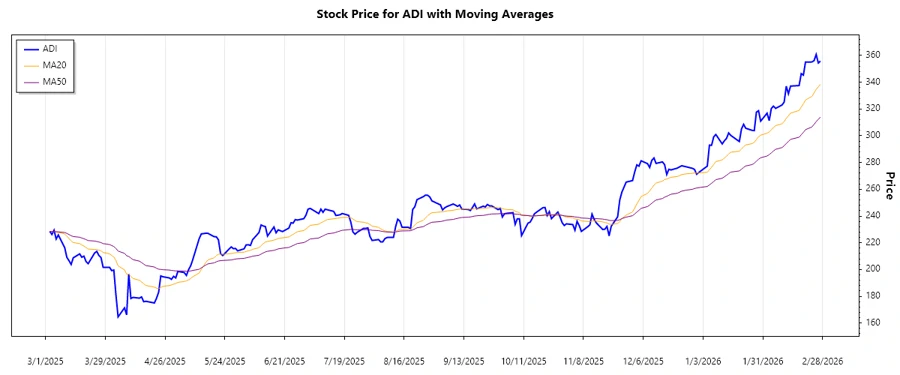
The stock has shown a general upward trend over the analyzed period. By calculating the Exponential Moving Averages (EMA) for 20 and 50 days, we derive that:
- EMA20 is consistently higher than EMA50, indicating a bullish ▲ uptrend.
| Date | Close Price | Trend |
|---|---|---|
| 2026-02-27 | $355.79 | ▲ Bullish |
| 2026-02-26 | $354.35 | ▲ Bullish |
| 2026-02-25 | $360.80 | ▲ Bullish |
| 2026-02-24 | $356.09 | ▲ Bullish |
| 2026-02-23 | $355.15 | ▲ Bullish |
| 2026-02-20 | $355.03 | ▲ Bullish |
| 2026-02-19 | $345.30 | ▲ Bullish |
The data supports a sustained bullish trend, making ADI a potentially profitable choice for investors looking for a growth stock.
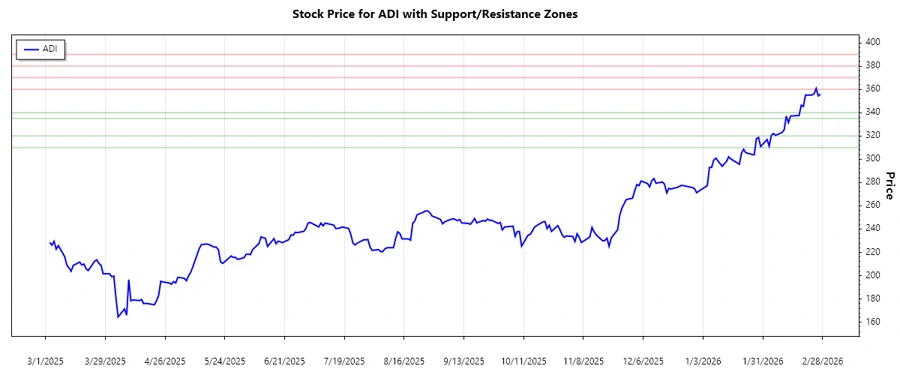
Support and Resistance
Key levels identified as strong support and resistance for ADI's stock:
| Zone Type | From | To |
|---|---|---|
| Support Zone 1 | $335.00 | $340.00 |
| Support Zone 2 | $310.00 | $320.00 |
| Resistance Zone 1 | $360.00 | $370.00 |
| Resistance Zone 2 | $380.00 | $390.00 |
The current price lies within the upper bounds of a significant resistance zone, suggesting that a breakout could lead to further upward movement. Technical indicators suggest a strong bullish sentiment, backed by the current trend analysis.
Conclusion
The continued upward momentum of Analog Devices, Inc., matched with technical support and resistance levels, paints a picture of potential growth but with inherent risks. Investors should monitor upcoming earnings reports and market conditions to ensure the sustainability of this trend. The current price near resistance levels suggests vigilance, however, the positive technological outlook is promising for long-term investors.
json **Note:** The support and resistance zones, as well as EMA calculations, are approximations based on observed price data and may require more sophisticated financial analysis or charting software for precise values and validation.