July 17, 2025 a 10:15 am
ADI: Fibonacci Analysis - Analog Devices, Inc.
Analog Devices, Inc. (ADI) has shown significant movements in its stock prices, reflecting its robust presence in the tech industry. The company plays a pivotal role in the manufacturing of integrated circuits, making it a key player in sectors such as automotive, industrial, and communications. As of the latest analysis, ADI is on an upward trend, suggesting strong market performance. Investors should remain cautious of market volatilities, given the global economic uncertainties, but the company's innovative edge presents a potentially favorable outlook.
Fibonacci Analysis
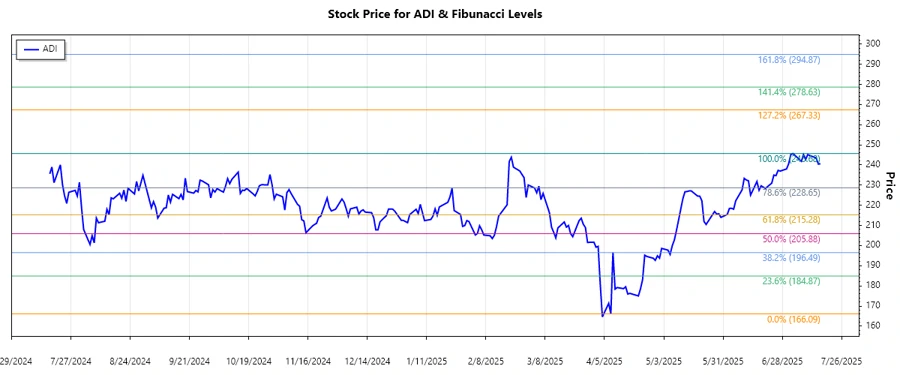
The analysis for Analog Devices reveals a strong upward trend over recent months. Using the lowest point of 166.09 on 2025-04-08 and the highest point of 245.68 on 2025-07-03, we conduct a Fibonacci retracement analysis to identify potential price support levels.
| Detail | Information |
|---|---|
| Trend Start Date | 2025-04-08 |
| Trend End Date | 2025-07-03 |
| Low Point | $166.09 (2025-04-08) |
| High Point | $245.68 (2025-07-03) |
Fibonacci Levels
| Retracement Level | Price Level |
|---|---|
| 0.236 | $225.77 |
| 0.382 | $213.86 |
| 0.5 | $205.88 |
| 0.618 | $197.90 |
| 0.786 | $185.99 |
Current stock price is near the 0.786 Fibonacci level, suggesting a possible support zone. This technical level may indicate a buying opportunity for investors aiming to leverage the ongoing trend.
The current analysis shows that ADI is in potential support territory around the 0.786 level, deliberating its strength amid market fluctuations.
Conclusion
Analog Devices (ADI) continues to perform well amidst the evolving technology sector landscape, exhibiting a strong bullish trend based on recent data. The ongoing positive trajectory reinforced by the Fibonacci analysis highlights critical support thresholds that align with investor interests for strategic entry points. However, with potential volatilities due to macroeconomic conditions, investors should consider both technical signals and broader market indicators before making investment decisions. The current retracement near the 0.786 Fibonacci level suggests a potential price stabilization area, offering an intriguing setup for investors anticipating market recovery scenarios.