
June 14, 2026 a 12:46 pm
ADI: Dividend Analysis - Analog Devices, Inc.
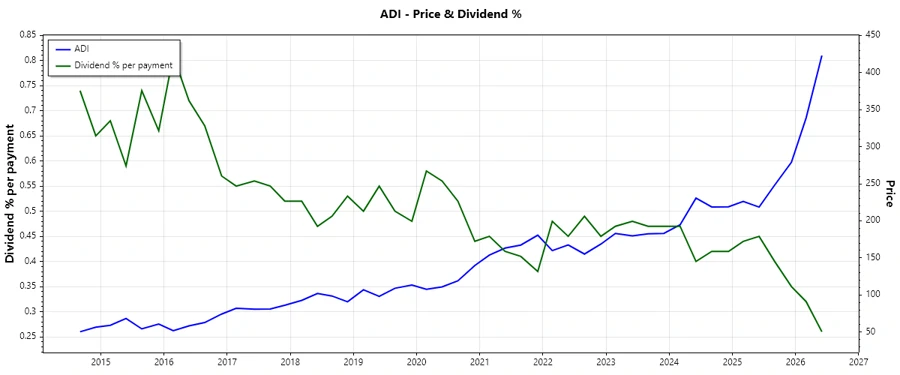
Analog Devices, Inc. is a noteworthy player in the semiconductor industry, with a robust track record of steady dividend payments over 24 years. Its current yield, though modest at 0.99%, signifies stability. The company's uninterrupted history of dividend growth showcases its potential for gradual income augmentation. Combined with a reasonable payout ratio of 57.3% based on EPS, ADI presents a balanced approach to rewarding shareholders while maintaining sufficient reinvestment for growth.
📊 Overview
Analog Devices stands as a formidable contender in the semiconductor sector, offering investors a blend of stability and growth in dividend returns. Despite a yield under 1%, its dividends are consistent and promising, with steady historical growth enhancing investor value over the years.
| Metric | Value |
|---|---|
| Sector | Semiconductor |
| Dividend yield | 0.99 % |
| Current dividend per share | 3.89 USD |
| Dividend history | 24 years |
| Last cut or suspension | None |
🗣️ Dividend History
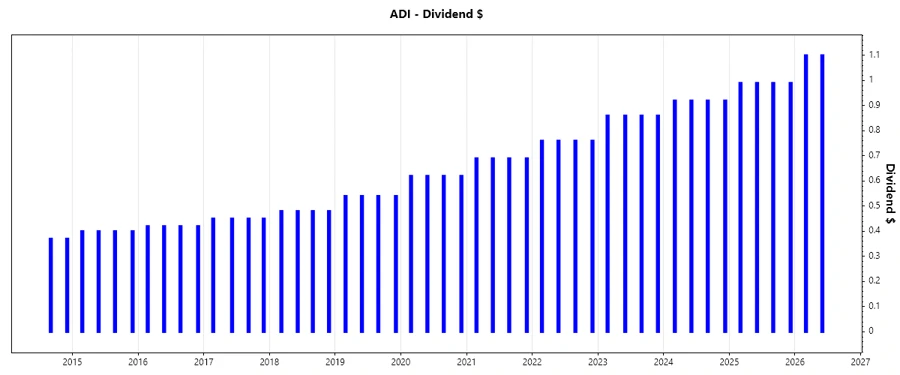
The dividend history of ADI is a testament to its robust financial health and strategic commitment to shareholder returns. Over the years, dividends have shown consistent progression, essential for long-term income-focused investors.
| Year | Dividend Per Share (USD) |
|---|---|
| 2026 | 2.20 |
| 2025 | 3.96 |
| 2024 | 3.68 |
| 2023 | 3.44 |
| 2022 | 3.04 |
📈 Dividend Growth
Dividend growth is a crucial indicator of a company's potential to increase shareholder returns over time. ADI's dividend growth over recent years underscores its dedication to enhancing investor value.
| Time | Growth |
|---|---|
| 3 years | 9.21 % |
| 5 years | 9.81 % |
The average dividend growth is 9.81% over 5 years. This shows moderate but steady dividend growth.
📉 Payout Ratio
The payout ratio reflects the proportion of earnings distributed as dividends, serving as a measure of sustainability. A balanced payout ratio ensures continued reinvestment in business growth.
| Key figure | Ratio |
|---|---|
| EPS-based | 57.28 % |
| Free cash flow-based | 41.53 % |
With an EPS payout ratio of 57.28% and a FCF payout ratio of 41.53%, ADI maintains a prudent balance between rewarding shareholders and ensuring capital availability for future growth.
✅ Cashflow & Capital Efficiency
Analyzing cash flow and capital efficiency helps evaluate a company's ability to manage its operations and financial obligations effectively. Here we observe ADI's performance over recent years.
| Metric | 2023 | 2024 | 2025 |
|---|---|---|---|
| Free Cash Flow Yield | 4.41% | 2.79% | 3.70% |
| Earnings Yield | 4.11% | 1.46% | 1.96% |
| CAPEX to Operating Cash Flow | 26.18% | 18.96% | 11.06% |
| Stock-based Compensation to Revenue | 2.44% | 2.79% | 2.92% |
| Free Cash Flow / Operating Cash Flow Ratio | 73.82% | 81.04% | 88.91% |
ADI's cash flow metrics indicate a solid foundation for sustaining operations and achieving capital efficiency goals. Positive yields and strategic use of CAPEX illustrate operational strength.
⚠️ Balance Sheet & Leverage Analysis
Assessing leverage and balance sheet strength provides insights into financial health and risk. Here are ADI's leverage metrics over recent years.
| Metric | 2023 | 2024 | 2025 |
|---|---|---|---|
| Debt-to-Equity | 0.197 | 0.217 | 0.256 |
| Debt-to-Assets | 0.144 | 0.159 | 0.181 |
| Debt-to-Capital | 0.165 | 0.179 | 0.204 |
| Net Debt to EBITDA | 0.982 | 1.346 | 1.226 |
| Current Ratio | 1.370 | 1.835 | 2.190 |
| Quick Ratio | 0.857 | 1.351 | 1.680 |
With improving current and quick ratios alongside controlled debt levels, ADI maintains a healthy leverage profile, signifying robust liquidity and financial stability.
📊 Fundamental Strength & Profitability
Evaluating fundamental strength and profitability indexes a company's overall efficiency and financial acumen. Here's an insight into ADI's metrics.
| Metric | 2023 | 2024 | 2025 |
|---|---|---|---|
| Return on Equity | 9.32% | 4.65% | 6.70% |
| Return on Assets | 6.79% | 3.39% | 4.72% |
| Return on Invested Capital | 7.52% | 4.04% | 5.42% |
| Net Profit Margin | 26.94% | 17.35% | 20.58% |
| Gross Profit Margin | 64.01% | 57.08% | 61.47% |
| EBIT Margin | 31.47% | 22.27% | 27.49% |
| EBITDA Margin | 50.11% | 44.59% | 45.63% |
| R&D to Revenue | 13.49% | 15.78% | 16.03% |
The fundamental metrics underscore profitability and cost management expertly aligned with industry standards, with slight deviations affirming adaptability and secure growth potential.
📈 Price Development
🎯 Dividend Scoring System
An evaluation of ADI's dividend metrics through a custom scoring system highlights key areas of strength and opportunities for improvement.
| Category | Score | |
|---|---|---|
| Dividend yield | 3 | |
| Dividend Stability | 5 | |
| Dividend growth | 4 | |
| Payout ratio | 4 | |
| Financial stability | 5 | |
| Dividend continuity | 5 | |
| Cashflow Coverage | 4 | |
| Balance Sheet Quality | 5 |
Total Score: 35/40
Rating
Analog Devices, Inc. showcases a commendable profile in dividend management, demonstrating steady growth and financial robustness. The strategic alignment of its dividend policies with sustainable business practices ensures resilience in varied market conditions. Recommended for investors seeking stable income with potential for capital appreciation.
Smart Data Insight
Master the Perfect Entry & Exit for this Stock
Don't leave your profits to chance. Historically, this stock follows specific seasonal patterns that institutional traders use to maximize returns.
- ✅ Identify the "Golden Buying Window"
- ✅ Avoid high-risk correction cycles
- ✅ Backtested data from the last 20+ years