November 12, 2025 a 07:46 am

ADI: Dividend Analysis - Analog Devices, Inc.
Analog Devices, Inc. presents a compelling dividend profile with a consistent dividend history and a moderate yield. The company's payout ratios indicate a balanced approach to shareholder returns, with a sustained commitment to enhancing shareholder value through dividends.
📊 Overview
Analog Devices, Inc. operates within the technology sector, offering a dividend yield of 1.57%. The current dividend per share stands at $3.62 and showcases a robust dividend history of 23 years with no cuts or suspensions.
| Metric | Value |
|---|---|
| Sector | Technology |
| Dividend Yield | 1.57% |
| Current Dividend per Share | $3.62 |
| Dividend History | 23 years |
| Last Cut or Suspension | None |
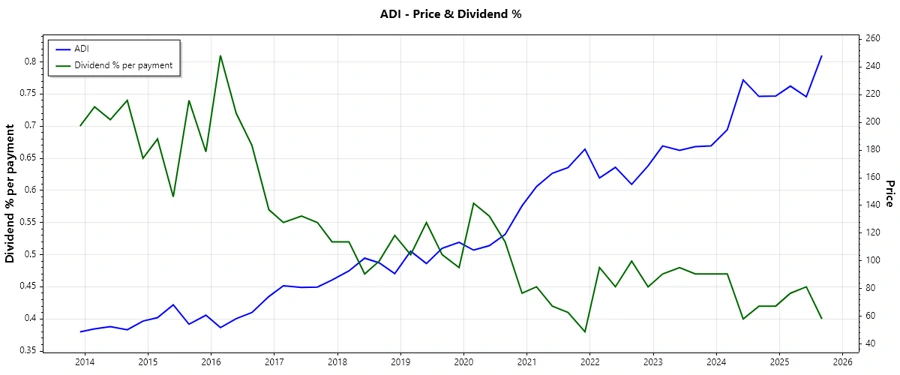
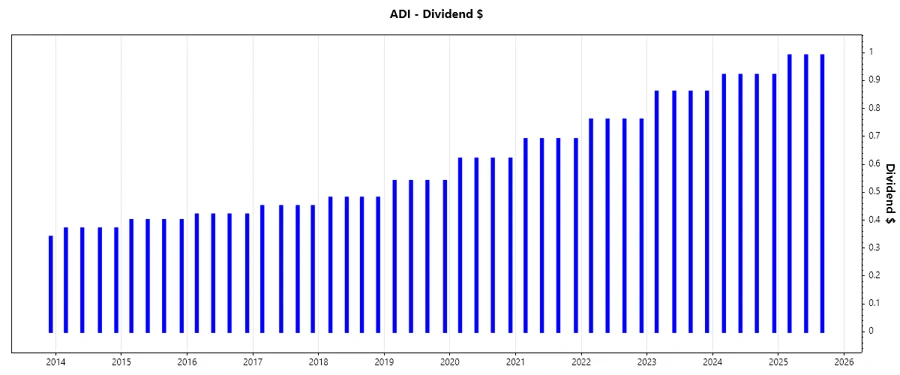
🗣️ Dividend History
Analyzing the dividend history of Analog Devices, Inc., the consistency in annual payouts reflects a strong and stable commitment to returning capital to shareholders. This history is crucial for income-focused investors seeking reliable returns.
| Year | Dividend per Share (USD) |
|---|---|
| 2025 | $2.97 |
| 2024 | $3.68 |
| 2023 | $3.44 |
| 2022 | $3.04 |
| 2021 | $2.76 |
📈 Dividend Growth
The recent dividend growth rates paint a promising picture for future dividend increases, driven by strong company performance and prudent fiscal management. This growth is significant as it indicates the company’s capability to enhance shareholder value incrementally.
| Time | Growth |
|---|---|
| 3 years | 10.06% |
| 5 years | 11.24% |
The average dividend growth is 11.24% over 5 years. This shows moderate but steady dividend growth.
✅ Payout Ratio
Earning-based and cash flow-based payout ratios are pivotal in assessing dividend sustainability. They illustrate the proportion of earnings and cash flow paid out as dividends, which is critical for evaluating dividend reliability.
| Key Figure | Ratio |
|---|---|
| EPS-based | 91.39% |
| Free Cash Flow-based | 48.77% |
The payout ratio of 91.39% (EPS) suggests a high proportion of earnings distributed as dividends, which may limit future payout increases. However, the 48.77% FCF ratio indicates a strong cash foundation supporting dividend operations.
💰 Cashflow & Capital Efficiency
A detailed analysis of cash flow metrics over recent fiscal years provides insight into Analog Devices' operational efficiency and financial stability. Understanding these metrics helps in determining the robustness of the company's cash generation capabilities.
| Metric | 2024 | 2023 | 2022 |
|---|---|---|---|
| Free Cash Flow Yield | 2.79% | 4.50% | 5.02% |
| Earnings Yield | 1.46% | 4.19% | 3.65% |
| CAPEX to Operating Cash Flow | 11.62% | 26.18% | 15.63% |
| Stock-based Compensation to Revenue | 2.94% | 2.44% | 2.69% |
| Free Cash Flow / Operating Cash Flow Ratio | 81.04% | 73.82% | 84.37% |
Analog Devices, Inc. showcases strong cash flow stability with efficient capital utilization, as evidenced by a consistent free cash flow yield and substantial earnings yield.
🏦 Balance Sheet & Leverage Analysis
The company's leverage ratios provide insights into its financial health and risk exposure. Maintaining optimal leverage is crucial for financial stability and flexibility.
| Metric | 2024 | 2023 | 2022 |
|---|---|---|---|
| Debt-to-Equity | 22.76% | 19.72% | 18.11% |
| Debt-to-Assets | 16.60% | 14.37% | 13.13% |
| Debt-to-Capital | 18.54% | 16.47% | 15.33% |
| Net Debt to EBITDA | 1.36 | 0.98 | 0.92 |
| Current Ratio | 2.32 | 1.37 | 2.02 |
| Quick Ratio | 1.35 | 0.86 | 1.45 |
The low leverage ratios coupled with robust liquidity metrics underscore a well-managed balance sheet, enhancing Analog Devices, Inc.'s financial resilience.
🌟 Fundamental Strength & Profitability
Analog Devices, Inc.'s profitability metrics reflect its operational efficiency and effectiveness in generating returns. These indicators are essential for evaluating the company's competitive position and long-term potential.
| Metric | 2024 | 2023 | 2022 |
|---|---|---|---|
| Return on Equity | 4.65% | 9.32% | 7.54% |
| Return on Assets | 3.39% | 6.79% | 5.46% |
| Net Profit Margin | 17.35% | 26.94% | 22.88% |
| Gross Profit Margin | 57.08% | 64.01% | 64.96% |
| EBIT Margin | 22.27% | 31.47% | 27.46% |
The company's solid profitability ratios reflect a robust business model with potential for sustained earnings growth, a crucial factor for long-term investors.
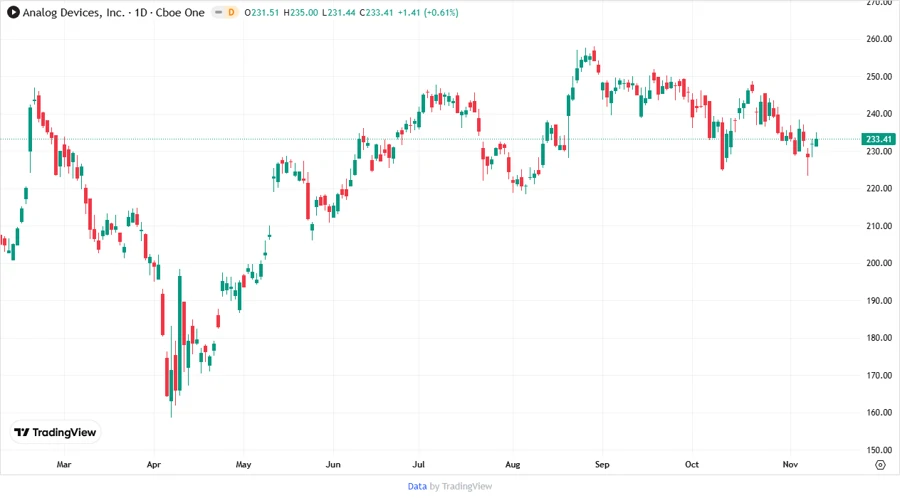
📉 Price Development
🎯 Dividend Scoring System
| Criteria | Score | Score Bar |
|---|---|---|
| Dividend Yield | 3 | |
| Dividend Stability | 5 | |
| Dividend Growth | 4 | |
| Payout Ratio | 3 | |
| Financial Stability | 4 | |
| Dividend Continuity | 5 | |
| Cashflow Coverage | 4 | |
| Balance Sheet Quality | 5 |
Total Score: 33/40
⭐ Rating
Analog Devices, Inc. is rated as a strong performer in the dividend arena, boasting a consistent and growing dividend profile alongside strong financial metrics. The company is well-positioned to continue providing shareholder value, making it an attractive option for dividend-focused investors.
Smart Data Insight
Master the Perfect Entry & Exit for this Stock
Don't leave your profits to chance. Historically, this stock follows specific seasonal patterns that institutional traders use to maximize returns.
- ✅ Identify the "Golden Buying Window"
- ✅ Avoid high-risk correction cycles
- ✅ Backtested data from the last 20+ years