October 26, 2025 a 02:46 am


ADI: Dividend Analysis - Analog Devices, Inc.
Analog Devices, Inc. showcases a tenacious foothold in the semiconductor industry, marked by substantial market capitalization and a longstanding dividend history. With a reliable payout streak and moderate dividend growth, ADI continues to appeal to income-focused investors. However, attention to its high EPS payout ratio suggests a need for prudent cash management going forward.
📊 Overview
Analog Devices operates within the technology sector, providing an attractive dividend yield of 1.57%. Presently, the dividend per share stands at $3.62, supported by a robust history of uninterrupted dividend payments for 23 years. Notably, there have been no recent cuts or suspensions, indicating a stable dividend policy.
| Metric | Value |
|---|---|
| Sector | Technology |
| Dividend yield | 1.57% |
| Current dividend per share | $3.62 |
| Dividend history | 23 years |
| Last cut or suspension | None |
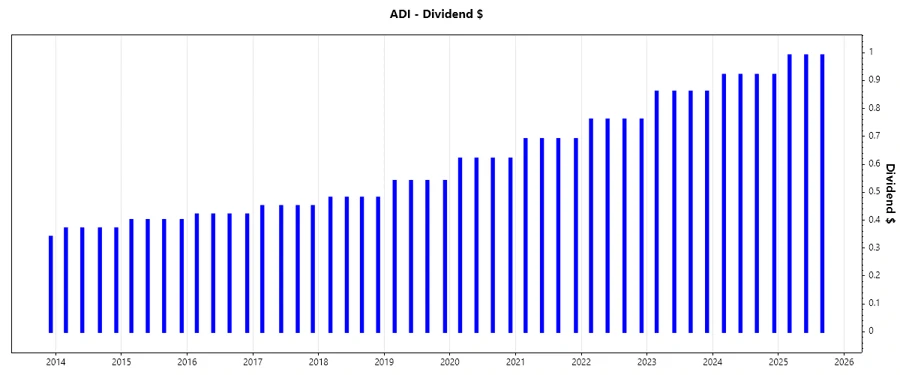
📈 Dividend History
Celebrated for its dividend history, ADI's consistent dividend growth reflects a solid financial foundation and shareholder commitment. Historical dividend increases are paramount for investors seeking reliability and income predictability.
| Year | Dividend per Share (USD) |
|---|---|
| 2025 | 2.97 |
| 2024 | 3.68 |
| 2023 | 3.44 |
| 2022 | 3.04 |
| 2021 | 2.76 |
📉 Dividend Growth
Dividend growth rates of 10.06% over three years and 11.24% over five years indicate healthy progression in shareholder returns. These figures are significant, underscoring management's confidence in future cash flows and business stability.
| Time | Growth |
|---|---|
| 3 years | 10.06% |
| 5 years | 11.24% |
The average dividend growth is 11.24% over 5 years. This shows moderate but steady dividend growth.
🗣️ Payout Ratio
The payout ratio signifies the proportion of earnings distributed to shareholders in dividends. A high EPS-based payout ratio of 91.39% may strain the company's reinvestment capacity or signal that future dividend increments will rely on profit expansion or free cash flow optimization.
| Key figure | Ratio |
|---|---|
| EPS-based | 91.39% |
| Free cash flow-based | 48.77% |
The EPS payout ratio of 91.39% is relatively high, suggesting ADI may forego some opportunities for growth investments. The more modest FCF payout at 48.77% reflects a solid buffer for sustaining dividend distributions.
✅ Cashflow & Capital Efficiency
Evaluation of ADI's cash flow and capital efficiency reveals strategic balances between operations and investments. Strong cash flow yield and prudent capital expenditures bolster divestment capabilities and shareholder returns.
| Metric | 2024 | 2023 | 2022 |
|---|---|---|---|
| Free Cash Flow Yield | 2.79% | 4.50% | 5.02% |
| Earnings Yield | 1.46% | 4.19% | 3.65% |
| CAPEX to Operating Cash Flow | 18.96% | 26.18% | 15.63% |
| Stock-based Compensation to Revenue | 2.79% | 2.43% | 2.69% |
| Free Cash Flow / Operating Cash Flow Ratio | 81.04% | 73.82% | 84.37% |
The analysis shows a resilient cash flow framework underpinning ADI's capacity for sustaining dividends and accommodating strategic initiatives, albeit necessitating careful management under varying economic conditions.
⚠️ Balance Sheet & Leverage Analysis
An exploration of ADI's balance sheet reveals a leverage strategy conducive to progressive growth without amplifying risk appreciably. The company's leverage ratios are generally within prudent ranges, allowing financial flexibility and stability.
| Metric | 2024 | 2023 | 2022 |
|---|---|---|---|
| Debt-to-Equity | 0.23 | 0.20 | 0.18 |
| Debt-to-Assets | 0.17 | 0.14 | 0.13 |
| Debt-to-Capital | 0.19 | 0.16 | 0.15 |
| Net Debt to EBITDA | 1.43 | 0.98 | 0.92 |
| Current Ratio | 2.32 | 1.37 | 2.02 |
| Quick Ratio | 1.35 | 0.86 | 1.45 |
| Financial Leverage | 1.37 | 1.37 | 1.38 |
ADI's leverage ratios demonstrate a balanced approach to capital financing, ensuring liquidity remains strong without overleveraging the company's prospects.
🗣️ Fundamental Strength & Profitability
Fundamental indicators highlight ADI's stable performance, leveraging sector expertise and robust margins to maintain competitive profitability.
| Metric | 2024 | 2023 | 2022 |
|---|---|---|---|
| Return on Equity | 4.65% | 9.32% | 7.54% |
| Return on Assets | 3.39% | 6.79% | 5.46% |
| Margins: Net | 17.35% | 26.94% | 22.88% |
| Margins: EBIT | 22.27% | 31.47% | 27.46% |
| Margins: EBITDA | 44.59% | 50.11% | 46.58% |
| Margins: Gross | 57.08% | 64.01% | 64.96% |
| R&D to Revenue | 15.78% | 13.49% | 14.15% |
These metrics reveal ADI's adept management of operational efficiencies, showcasing strong returns across key profitability dimensions.
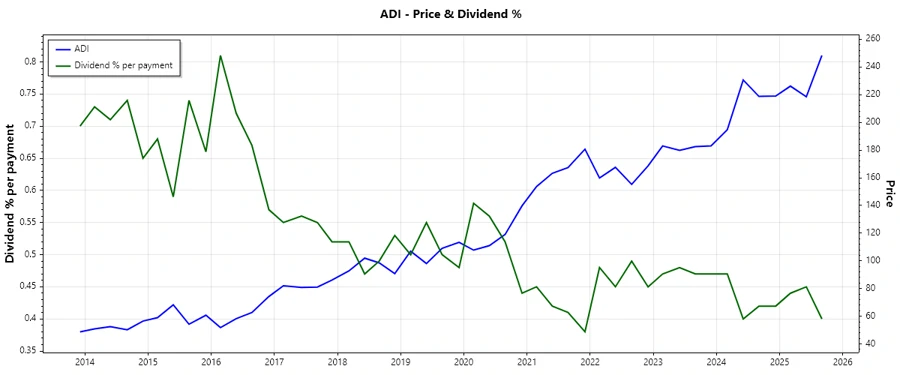
📈 Price Development
📊 Dividend Scoring System
| Criteria | Score | Score Bar |
|---|---|---|
| Dividend yield | 3 | |
| Dividend Stability | 5 | |
| Dividend growth | 4 | |
| Payout ratio | 3 | |
| Financial stability | 4 | |
| Dividend continuity | 5 | |
| Cashflow Coverage | 4 | |
| Balance Sheet Quality | 4 |
Total Score: 32/40
🗣️ Rating
ADI stands as a reliable, income-generating investment within the technology sector. With strong dividend continuity and consistent payout growth, it's well-positioned for income-oriented portfolios. However, caution is advised regarding its elevated EPS payout ratio, balancing immediate income objectives with long-term growth potential.
Smart Data Insight
Master the Perfect Entry & Exit for this Stock
Don't leave your profits to chance. Historically, this stock follows specific seasonal patterns that institutional traders use to maximize returns.
- ✅ Identify the "Golden Buying Window"
- ✅ Avoid high-risk correction cycles
- ✅ Backtested data from the last 20+ years