October 24, 2025 a 11:31 am


ADI: Dividend Analysis - Analog Devices, Inc.
Analog Devices, Inc. (ADI) presents a robust dividend profile in the semiconductor sector. The company showcases a sustainable dividend yield complemented by a commendable growth trajectory over recent years. With substantial market capitalization, ADI demonstrates its commitment to shareholder returns through consistent dividend payouts and growth. Carefully assessing its payout ratios indicates a strong balance between profit distributions and reinvestment strategies.
📊 Overview
ADI operates within the semiconductor sector, maintaining an impressive dividend track. With a current yield of 1.57% and a dividend history spanning 23 years, the company showcases resilience and continuity in dividend payouts. Notably, ADI has avoided recent dividend cuts or suspensions, underscoring its commitment to shareholders.
| Metric | Details |
|---|---|
| Sector | Semiconductors |
| Dividend yield | 1.57% |
| Current dividend per share | 3.62 USD |
| Dividend history | 23 years |
| Last cut or suspension | None |
📈 Dividend History
Examining ADI's dividend history reveals a positive growth trend over the past years, offering stability and predictability. This reliable history is crucial for investors valuing income consistency.
| Year | Dividend Per Share (USD) |
|---|---|
| 2025 | 2.97 |
| 2024 | 3.68 |
| 2023 | 3.44 |
| 2022 | 3.04 |
| 2021 | 2.76 |
📊 Dividend Growth
The consistent growth of ADI's dividends reflects the company's commitment to enhancing shareholder value. Tracking growth rates over three and five years indicates a stable appreciation in dividend payments.
| Time | Growth |
|---|---|
| 3 years | 10.06% |
| 5 years | 11.24% |
The average dividend growth is 11.24% over 5 years. This shows moderate but steady dividend growth.
⚖️ Payout Ratio
Analyzing payout ratios offers insights into how well ADI's earnings cover its dividends. EPS-based ratios exceeding 91% signify high distribution levels, whereas FCF-based ratios of 48% present a moderate but manageable payout strategy.
| Key figure | Ratio |
|---|---|
| EPS-based | 91.39% |
| Free cash flow-based | 48.77% |
The high EPS-based payout ratio reflects a significant portion of earnings allocated to dividends, while the FCF-based ratio indicates a conservative, cash-efficient approach to dividend payments.
💰 Cashflow & Capital Efficiency
Analyzing free cash flow yield and capital efficiency metrics provides a perspective on ADI's operational performance and capital management efficacy.
| Year | 2024 | 2023 | 2022 |
|---|---|---|---|
| Free Cash Flow Yield | 2.79% | 4.41% | 5.02% |
| Earnings Yield | 1.46% | 4.11% | 3.65% |
| CAPEX to Operating Cash Flow | 11.62% | 26.18% | 15.63% |
| Stock-based Compensation to Revenue | 2.94% | 2.43% | 2.69% |
| Free Cash Flow / Operating Cash Flow Ratio | 81.04% | 73.82% | 84.37% |
The analysis of cashflow and capital efficiency highlights strong cash generation capabilities, with a notable improvement in the free cash flow to operating cash flow ratio, strengthening financial stability.
🏦 Balance Sheet & Leverage Analysis
Examining leverage metrics and balance sheet strength sheds light on ADI's financial risk management and liquidity position.
| Year | 2024 | 2023 | 2022 |
|---|---|---|---|
| Debt-to-Equity | 22.76% | 19.72% | 18.11% |
| Debt-to-Assets | 16.60% | 14.37% | 13.13% |
| Debt-to-Capital | 18.54% | 16.47% | 15.33% |
| Net Debt to EBITDA | 1.43 | 0.98 | 0.92 |
| Current Ratio | 2.32 | 1.37 | 2.02 |
| Quick Ratio | 1.35 | 0.86 | 1.45 |
| Financial Leverage | 1.37 | 1.37 | 1.38 |
The analysis indicates a solid balance sheet with moderate leverage, enhancing ADI's debt service capacity and financial flexibility.
📊 Fundamental Strength & Profitability
Reviewing profitability metrics furnishes insights into ADI's operational efficiency and competitive standing within its industry.
| Year | 2024 | 2023 | 2022 |
|---|---|---|---|
| Return on Equity | 4.65% | 9.32% | 7.54% |
| Return on Assets | 3.39% | 6.79% | 5.46% |
| Margins: Net | 17.35% | 26.94% | 22.88% |
| EBIT Margin | 22.27% | 31.47% | 27.46% |
| EBITDA Margin | 44.59% | 50.10% | 46.58% |
| Gross Margin | 57.08% | 64.01% | 64.96% |
| Research & Development to Revenue | 15.78% | 13.49% | 14.15% |
ADI reports strong profitability metrics, bolstering its reputation for operational efficiency and solidifying its competitive advantage.
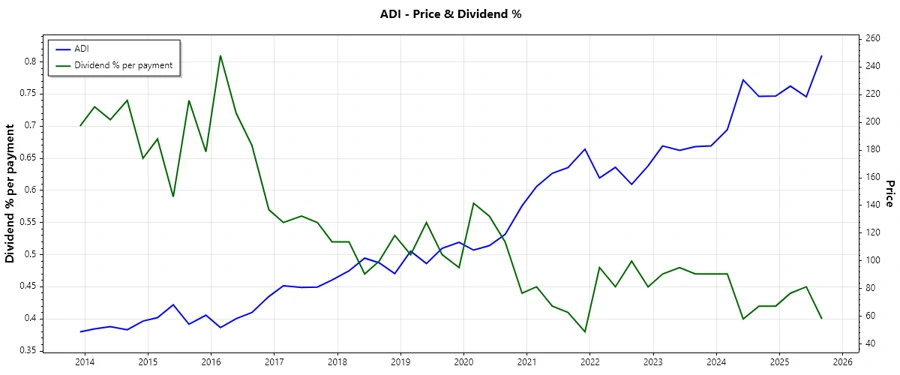
📈 Price Development
📉 Dividend Scoring System
| Criterion | Details | Score |
|---|---|---|
| Dividend yield | Moderate | |
| Dividend Stability | High | |
| Dividend growth | Consistent | |
| Payout ratio | Moderate | |
| Financial stability | Strong | |
| Dividend continuity | Solid | |
| Cashflow Coverage | Reliable | |
| Balance Sheet Quality | Robust |
Total Score: 32/40
✅ Rating
Analog Devices, Inc. offers a compelling dividend profile characterized by strong growth, stable payouts, and a well-managed payout ratio. Despite a high EPS-based payout, its financial stability and robust balance sheet provide confidence in future payouts. Investing in ADI is recommended for shareholders seeking a stable income stream paired with growth potential.