
July 08, 2026 a 08:15 am
ADBE: Trend and Support & Resistance Analysis - Adobe Inc.
Adobe Inc. has shown significant volatility over the analyzed period. With its global operations and diverse product portfolio, the company's stock is influenced by various market forces. Recently, the stock displayed a notable downward trend but has potential for recovery considering the company's strong fundamentals. Investors should consider both the current market environment and Adobe's strategic position in the software industry.
Trend Analysis
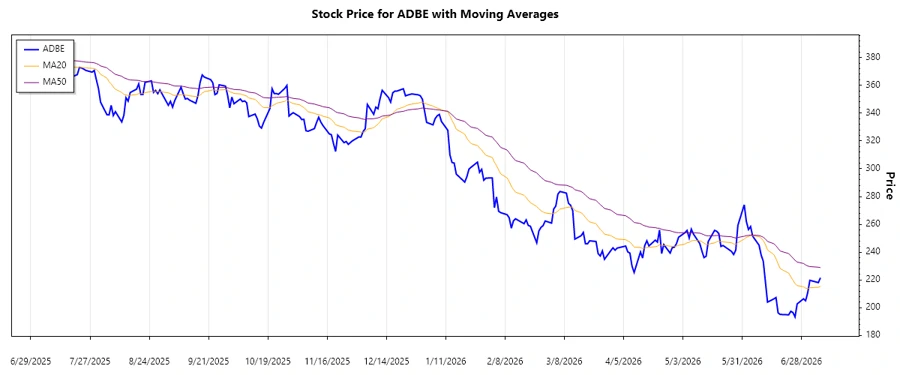
The analysis of the closing prices for Adobe (ADBE) highlights a recent downward trend. Calculating the EMA (Exponential Moving Averages), the EMA20 is below the EMA50, indicating a ▼ downward trend over the last period.
| Date | Closing Price | Trend |
|---|---|---|
| 2026-07-07 | 221.54 | ▼ |
| 2026-07-06 | 218.07 | ▼ |
| 2026-07-02 | 219.72 | ▼ |
| 2026-07-01 | 210.98 | ▼ |
| 2026-06-30 | 205.02 | ▼ |
| 2026-06-29 | 206.43 | ▼ |
| 2026-06-26 | 202.73 | ▼ |
Technical interpretation indicates a continued bearish momentum with limited short-term upward corrections.
Support- and Resistance
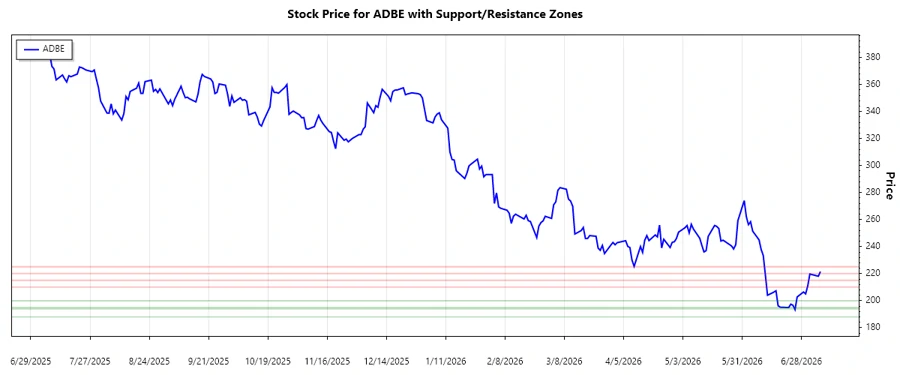
The analysis of Adobe's stock identifies the following support and resistance zones based on recent closing prices:
| Zone | From | To |
|---|---|---|
| Support 1 | 195.00 | 200.00 |
| Support 2 | 188.00 | 194.00 |
| Resistance 1 | 210.00 | 215.00 |
| Resistance 2 | 220.00 | 225.00 |
Currently, the stock is close to the upper support zone, which could act as a pivotal point for potential reversal.
Conclusion
Adobe Inc.'s stock is experiencing a bearish trend, evident from the EMA indicators. While current prices suggest vulnerability, they also highlight potential buying opportunities for long-term investors if support holds. Analysts should keep an eye on closing prices near key support and resistance zones as these could indicate future price movements. The company's strong market position in digital media and experiences may drive future recovery, but short-term selloffs could persist.
Smart Data Insight
Master the Perfect Entry & Exit for this Stock
Don't leave your profits to chance. Historically, this stock follows specific seasonal patterns that institutional traders use to maximize returns.
- ✅ Identify the "Golden Buying Window"
- ✅ Avoid high-risk correction cycles
- ✅ Backtested data from the last 20+ years