December 09, 2025 a 04:03 am

ADBE: Trend and Support & Resistance Analysis - Adobe Inc.
Adobe Inc., a leader in the digital software industry, shows promising growth through its diverse product segments. The latest price movements indicate a slight rise in investor confidence. A detailed trend and support-resistance analysis can provide more insights into the potential directional moves of the stock. Investors should keep an eye on key levels and moving averages for further investment decisions.
Trend Analysis
| Date | Closing Price | Trend |
|---|---|---|
| 2025-12-01 | 322.85 | ▼ |
| 2025-12-02 | 322.81 | ▼ |
| 2025-12-03 | 326.78 | ▼ |
| 2025-12-04 | 328.73 | ▼ |
| 2025-12-05 | 346.26 | ▲ |
| 2025-12-08 | 339.12 | ▲ |
Overall, the EMA calculations suggest a slight bearish trend as the EMA20 marginally trails the EMA50, indicating mild selling pressure in recent sessions.
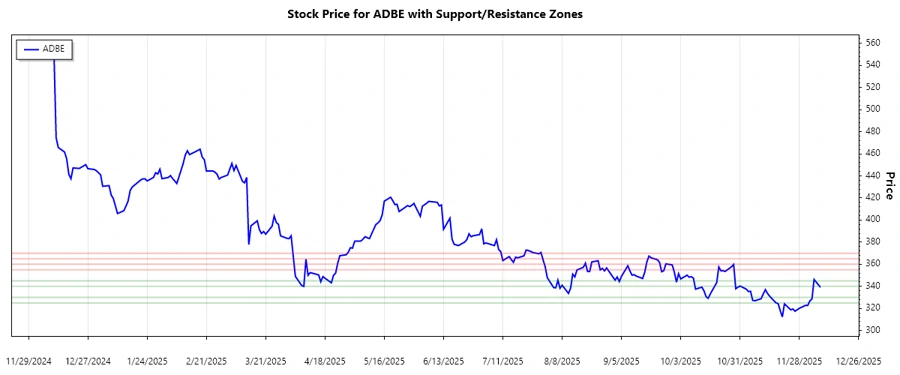
Support and Resistance
| Zone Type | From ($) | To ($) |
|---|---|---|
| Support Zone 1 | 325.00 | 330.00 |
| Support Zone 2 | 340.00 | 345.00 |
| Resistance Zone 1 | 355.00 | 360.00 |
| Resistance Zone 2 | 365.00 | 370.00 |
The stock is currently approaching the lower support zone, suggesting potential buying interest around this price level.
Conclusion
Adobe Inc.'s stock shows a slight bearish pattern but is approaching critical support levels that may entice buyers. With the digital media and experience segments continuing to innovate, there are growth opportunities ahead. Any price rebound from support zones could indicate a potential upside. However, traders should be cautious of any breakout below support levels which could lead to further declines. Monitoring market sentiment and upcoming earnings reports will also be crucial in making informed investment decisions.