April 23, 2025 a 02:00 pm


ADBE: Trend and Support & Resistance Analysis - Adobe Inc.
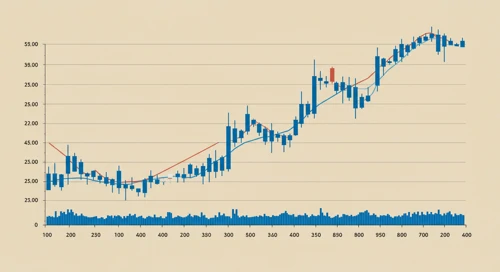
Adobe Inc. has shown a significant shift in its stock prices over the past months. As of the latest data analyzed, the stock has exhibited various trends influenced by market factors and company performance. Understanding these trends gives investors insights into optimal buying and selling points. Key support and resistance zones are identified to help strategize market entry and exit.
Trend Analysis
| Date | Close Price | Trend |
|---|---|---|
| 2025-04-23 | $360.00 | ⚖️ |
| 2025-04-22 | $349.91 | ⚖️ |
| 2025-04-21 | $343.22 | ▼ |
| 2025-04-17 | $348.80 | ▼ |
| 2025-04-16 | $344.19 | ▼ |
| 2025-04-15 | $350.38 | ⚖️ |
| 2025-04-14 | $350.91 | ⚖️ |
The recent trend indicates a shift towards a neutral or sideways movement, suggesting a consolidation phase in the market.
Support and Resistance
| Zone Type | From | To |
|---|---|---|
| Support 1 | $340.00 | $350.00 |
| Support 2 | $320.00 | $330.00 |
| Resistance 1 | $370.00 | $380.00 |
| Resistance 2 | $390.00 | $400.00 |
The current price is nearing the support zone between $340 and $350, providing a potential buying opportunity if the price holds.
Conclusion
Adobe Inc.'s stock has showcased a variety of trends recently, transitioning from a downward to a more neutral, sideways movement. This suggests the market is in a consolidation phase. The support and resistance zones identified provide strategic points for potential investment decisions. As the current price nears a support level, investors could find opportunities for entry. However, the market remains volatile, with upward trending potential if resistance levels are breached. Understanding these patterns is crucial for informed decision-making.
Smart Data Insight
Master the Perfect Entry & Exit for this Stock
Don't leave your profits to chance. Historically, this stock follows specific seasonal patterns that institutional traders use to maximize returns.
- ✅ Identify the "Golden Buying Window"
- ✅ Avoid high-risk correction cycles
- ✅ Backtested data from the last 20+ years