April 24, 2026 a 02:03 pm

ACGL: Trend and Support & Resistance Analysis - Arch Capital Group Ltd.
Arch Capital Group Ltd. has shown resilience in a dynamic market environment with diverse insurance products. The recent data suggests a series of fluctuations but reveals significant patterns when closely analyzed. Both short-term and long-term trends can be discerned through technical indicators that may provide insights for future performance. Investment decisions should consider the current trend indicators and support/resistance levels for an informed strategy.
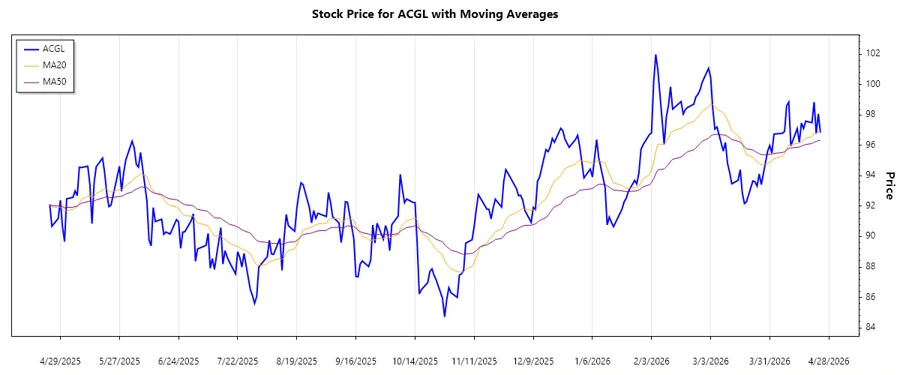
Trend Analysis
Recent data for ACGL indicates notable trends over the period analyzed. By calculating the Exponential Moving Averages (EMA20 and EMA50) from closing prices, we can observe specific directional trends. Currently, the EMA20 is slightly below the EMA50, reflecting a ▼ minor downward trend, but recent days show attempts to close this gap. This interplay suggests potential volatility and adjustments ahead.
| Date | Close Price | Trend |
|---|---|---|
| 2026-04-24 | 96.83 | ▼ |
| 2026-04-23 | 98.07 | ▲ |
| 2026-04-22 | 96.77 | ▼ |
| 2026-04-21 | 98.85 | ▲ |
| 2026-04-20 | 97.49 | ▼ |
| 2026-04-17 | 97.59 | ▲ |
| 2026-04-16 | 97.10 | ▼ |
The EMA analysis suggests a cautious approach for investors, with indications of fluctuations requiring close monitoring.
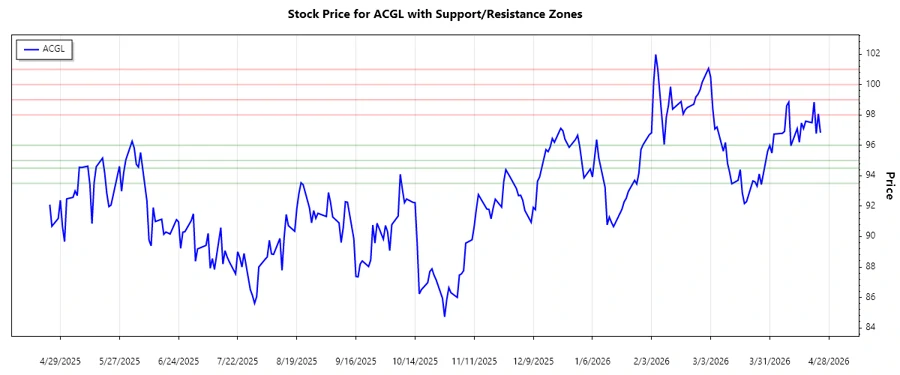
Support and Resistance
The analysis identifies key support and resistance zones that have shaped ACGL's trading patterns recently. The closing prices show potential support zones approximately between 93.50 to 94.50 and 95.00 to 96.00. Likewise, key resistance zones appear around 98.00 to 99.00 and 100.00 to 101.00. The current price appears near the first resistance zone, indicating a potential retest.
| Zone Type | From | To |
|---|---|---|
| Support | 93.50 | 94.50 ▲ |
| Support | 95.00 | 96.00 ▲ |
| Resistance | 98.00 | 99.00 ▼ |
| Resistance | 100.00 | 101.00 ▼ |
Currently, ACGL is positioned near a resistance zone, suggesting possible challenges in surpassing it without significant trading volume or positive catalysts.
Conclusion
Arch Capital Group Ltd. displays a mixed yet broadly positive chart pattern. The presence near key resistance zones, paired with a marginal downward EMA indicator, recommends caution to investors but highlights the potential for breaks or a drop dependent on forthcoming market news or company performance. Traders should adapt quickly to shifts, leveraging alerts around the EMA crossings and significant price levels. Overall, despite short-term pressures, the resilient positioning in insurance and reinsurance markets offers long-term growth possibilities if external market conditions stabilize positively.