September 08, 2025 a 09:03 am


ACGL: Trend and Support & Resistance Analysis - Arch Capital Group Ltd.
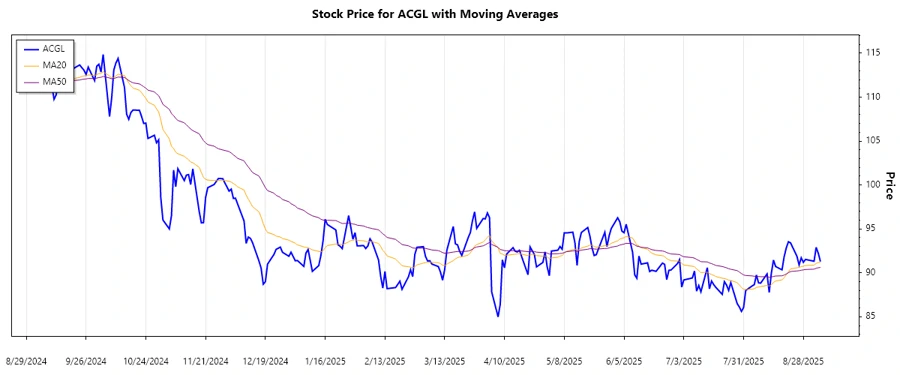
Arch Capital Group Ltd., engaged in providing insurance and reinsurance, recently showcased a series of fluctuating stock movements. With diverse segments covering financial-related coverages, the stock's dynamics can reflect varying factors of market perception and strategic direction. As the company expands its global reach, technical analysis of ACGL allows investors to anticipate stock trajectory amidst evolving market conditions.
Trend Analysis
The ACGL stock demonstrates a nuanced pattern over the past months. Based on the computed EMAs, a slight upward trend was noticed with the EMA20 slightly exceeding the EMA50 over recent days. Daily price movements have indicated a short-term bullish outlook with potential room for continued growth.
| Date | Close Price | Trend |
|---|---|---|
| 2025-09-05 | 91.29 | ▲ |
| 2025-09-04 | 92.22 | ▲ |
| 2025-09-03 | 92.9 | ▲ |
| 2025-09-02 | 91.32 | ▼ |
| 2025-08-29 | 91.53 | ▲ |
| 2025-08-28 | 91.2 | ▼ |
| 2025-08-27 | 91.71 | ▲ |
Technically, the positive momentum is gaining traction, suggesting the likelihood of continued upward movements unless disrupted by external factors.
Support and Resistance
Analysis of ACGL exhibits notable support and resistance levels. Observed from previous lows and highs, these zones present calculated points of potential reversal.
| Zone | From | To |
|---|---|---|
| Support Zone 1 | 89.00 | 90.00 |
| Support Zone 2 | 85.00 | 87.00 |
| Resistance Zone 1 | 94.00 | 95.00 |
| Resistance Zone 2 | 100.00 | 102.00 |
The current price stands within a notable support zone, hinting at potential price stabilization or a bounce. These resistance levels provide future selling targets or reversal alerts, crucial for scheduling exits.
Conclusion
Overall, ACGL exhibits a cautiously optimistic outlook, buttressed by strategic positioning across insurance sectors. Risks remain in market volatility which could affect technical indicators. On the technical front, emerging upward trends and pivotal support zones could present buying opportunities for growth-seeking investors. However, the presence of established resistance zones should alert to potential sell-offs. Analysts maintain a vigilant stance, recognizing that future corrections might reset technical footholds.
Smart Data Insight
Master the Perfect Entry & Exit for this Stock
Don't leave your profits to chance. Historically, this stock follows specific seasonal patterns that institutional traders use to maximize returns.
- ✅ Identify the "Golden Buying Window"
- ✅ Avoid high-risk correction cycles
- ✅ Backtested data from the last 20+ years