
July 01, 2026 a 01:00 pm
ACGL: Fundamental Ratio Analysis - Arch Capital Group Ltd.
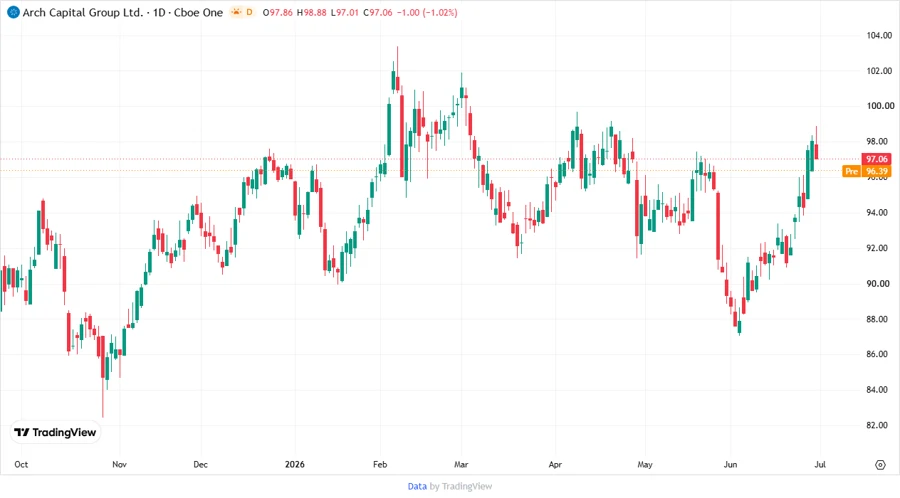
Arch Capital Group Ltd. is renowned for its diverse insurance offerings across multiple continents. As a staple in the Financial Services sector, its consistent performance metrics paint a promising picture for potential investors. Recent scores highlight robust financial health and a diversified investment strategy.
Fundamental Rating
The fundamental metrics for ACGL indicate a robust financial position, with strong scores in critical areas. Below are the detailed scores and their visual representations.
| Category | Score | Visualization |
|---|---|---|
| Discounted Cash Flow | 5 | |
| Return on Equity | 5 | |
| Return on Assets | 5 | |
| Debt to Equity | 3 | |
| Price to Earnings | 3 | |
| Price to Book | 2 |
Historical Rating
Historical data show a consistent performance, which underpins its resilience and strategic capabilities in the market.
| Date | Overall | DCF | ROE | ROA | Debt to Equity | Price to Earnings | Price to Book |
|---|---|---|---|---|---|---|---|
| 2026-07-01 | 4 | 5 | 5 | 5 | 3 | 3 | 2 |
| 2026-06-30 | 4 | 5 | 5 | 5 | 3 | 3 | 2 |
Analyst Price Targets
Analyst estimates demonstrate a promising outlook, with consistent median estimates reinforcing confidence in ACGL’s market position.
| High | Low | Median | Consensus |
|---|---|---|---|
| 114 | 93 | 102 | 102.57 |
Analyst Sentiment
The market sentiment for ACGL is favorable, indicating strong buy and hold recommendations among analysts.
| Recommendation | Count | Distribution |
|---|---|---|
| Strong Buy | 0 | |
| Buy | 16 | |
| Hold | 16 | |
| Sell | 2 | |
| Strong Sell | 0 |
Conclusion
Arch Capital Group Ltd. presents itself as a solid investment candidate given its strong fundamental scores and stable historical data. The favorable analyst ratings further emphasize its investment potential. However, risks such as market volatility and sector-specific challenges must be factored into decision-making. Overall, ACGL's diversified portfolio across insurance and reinsurance provides a well-rounded foundation for future growth.
Smart Data Insight
Master the Perfect Entry & Exit for this Stock
Don't leave your profits to chance. Historically, this stock follows specific seasonal patterns that institutional traders use to maximize returns.
- ✅ Identify the "Golden Buying Window"
- ✅ Avoid high-risk correction cycles
- ✅ Backtested data from the last 20+ years