
June 29, 2026 a 03:43 pm

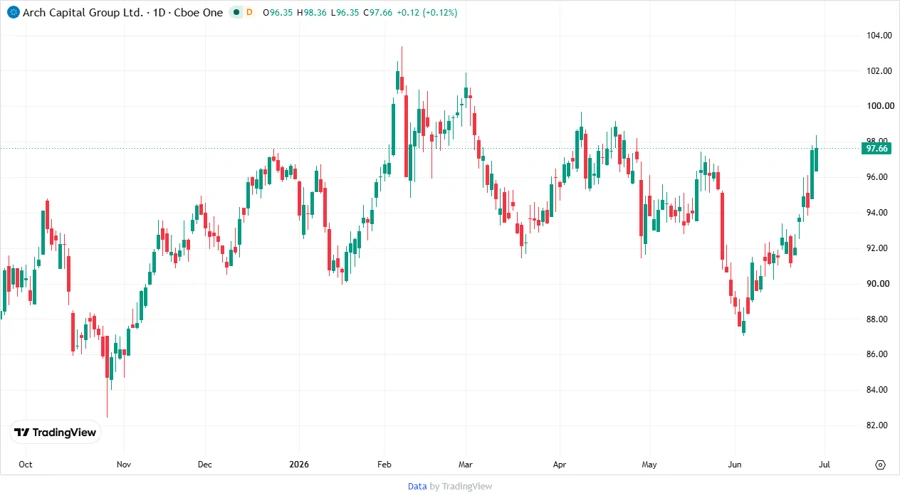
ACGL: Fundamental Ratio Analysis - Arch Capital Group Ltd.
Arch Capital Group Ltd., a diversified insurance company, continues to showcase solid performance across its international markets. Despite the volatile market environment, ACGL maintains high ratings in key financial metrics, making it a resilient choice for investors. Caution is advised as external factors influencing insurance demands are unpredictable.
Fundamental Rating
The most recent fundamental data indicates a stable and robust performance by Arch Capital Group Ltd. Here is a closer look at the rating scores:
| Category | Score | Visualization |
|---|---|---|
| Discounted Cash Flow | 5 | |
| Return on Equity | 5 | |
| Return on Assets | 5 | |
| Debt to Equity | 3 | |
| Price to Earnings | 3 | |
| Price to Book | 2 |
Historical Rating
Comparing the historical data, ACGL shows consistency in its financial metrics over time. Below is the comparison of past and current ratings:
| Date | Overall Score | DCF | ROE | ROA | Debt to Equity | Price to Earnings | Price to Book |
|---|---|---|---|---|---|---|---|
| 2026-06-29 | 4 | 5 | 5 | 5 | 3 | 3 | 2 |
| 2026-06-25 | 4 | 5 | 5 | 5 | 3 | 3 | 2 |
Analyst Price Targets
Analysts maintain positive expectations with a median target aligned close to the consensus. Here are the details:
| High | Low | Median | Consensus |
|---|---|---|---|
| 114 | 93 | 102 | 102.57 |
Analyst Sentiment
Current consensus remains a 'Buy', with sentiments being absorbed in the following breakdown:
| Recommendation | Count | Visualization |
|---|---|---|
| Strong Buy | 0 | |
| Buy | 16 | |
| Hold | 16 | |
| Sell | 2 | |
| Strong Sell | 0 |
Conclusion
Arch Capital Group Ltd. displays strong and consistent financial metrics, indicating a well-managed company with reliable performance. The rating scores and analyst sentiments strongly suggest a positive outlook, but potential investors should be mindful of market instabilities affecting business segments. The current 'Buy' recommendation from analysts highlights optimism, yet ongoing assessments are advised to mitigate risks.
Smart Data Insight
Master the Perfect Entry & Exit for this Stock
Don't leave your profits to chance. Historically, this stock follows specific seasonal patterns that institutional traders use to maximize returns.
- ✅ Identify the "Golden Buying Window"
- ✅ Avoid high-risk correction cycles
- ✅ Backtested data from the last 20+ years