
October 01, 2025 a 06:00 pm
ACGL: Fundamental Ratio Analysis - Arch Capital Group Ltd.
Arch Capital Group Ltd. operates in a diversified financial services sector, providing comprehensive insurance, reinsurance, and mortgage insurance products globally. Given its solid fundamentals and broad market reach, ACGL stands as a prominent entity in the insurance industry. However, the company's debt-to-equity ratio warrants cautious consideration by potential investors.
Fundamental Rating
The company's fundamental scores reflect a robust financial position, particularly in cash flow management and asset returns. However, it displays some exposure to financial leverage risks.
| Category | Score | Score Bar |
|---|---|---|
| Discounted Cash Flow | 5 | |
| Return on Equity | 5 | |
| Return on Assets | 5 | |
| Debt to Equity | 2 | |
| Price to Earnings | 3 | |
| Price to Book | 2 |
Historical Rating
The historical ratings provide insight into the company's performance trends over time, highlighting the consistency in certain financial metrics.
| Date | Overall | DCF | ROE | ROA | D/E | P/E | P/B |
|---|---|---|---|---|---|---|---|
| 2025-10-01 | 4 | 5 | 5 | 5 | 2 | 3 | 2 |
| (Previous Date) | 0 | 5 | 5 | 5 | 2 | 3 | 2 |
Analyst Price Targets
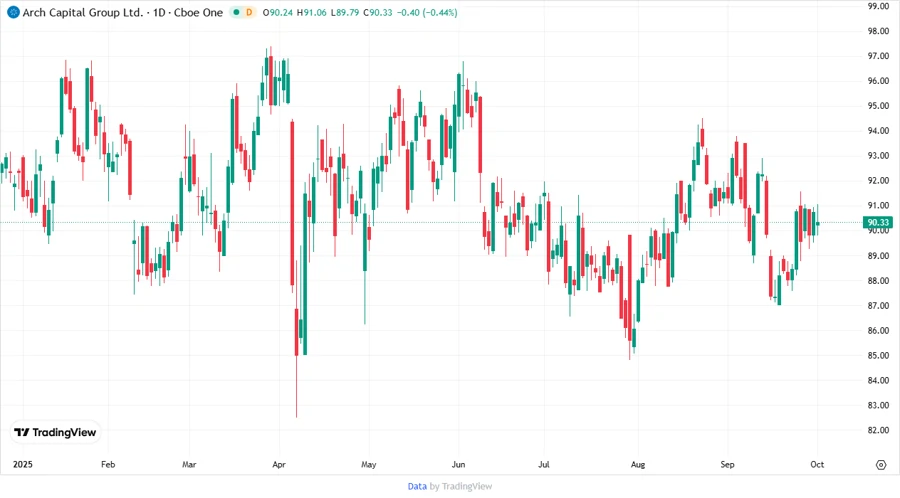
The consensus among analysts suggests a median target price aligned closely with the stock's current performance, primarily sustaining a hold recommendation.
| High | Low | Median | Consensus |
|---|---|---|---|
| 110 | 108 | 109 | 109 |
Analyst Sentiment
Overall, the analyst sentiment indicates a divided perspective, with a significant number leaning towards holding the stock.
| Recommendation | Count | Distribution |
|---|---|---|
| Strong Buy | 0 | |
| Buy | 14 | |
| Hold | 16 | |
| Sell | 1 | |
| Strong Sell | 0 |
Conclusion
Arch Capital Group Ltd. emerges as a stalwart in the financial sector, fortified by robust metrics in cash flow and asset returns. Nonetheless, its debt to equity ratio poses a moderate risk which should be thoroughly scrutinized by stakeholders. Current analyst sentiment and price targets exhibit a stable yet cautious outlook, indicating a hold strategy might be beneficial in the short term. The consistent historical performance affirms the company’s steadiness but underscores the importance of monitoring future financial dynamics.
Smart Data Insight
Master the Perfect Entry & Exit for this Stock
Don't leave your profits to chance. Historically, this stock follows specific seasonal patterns that institutional traders use to maximize returns.
- ✅ Identify the "Golden Buying Window"
- ✅ Avoid high-risk correction cycles
- ✅ Backtested data from the last 20+ years