May 15, 2026 a 04:44 pm
ACGL: Fibonacci Analysis - Arch Capital Group Ltd.
Arch Capital Group Ltd., with a diversified portfolio in insurance and reinsurance, has shown a compelling market performance. The recent trend in its stock price indicates substantial movement influenced by global insurance demands and economic conditions. Investors are advised to keep a close watch on the stock's performance metrics, as it can provide insights into future market behavior.
Fibonacci Analysis
| Detail | Information |
|---|---|
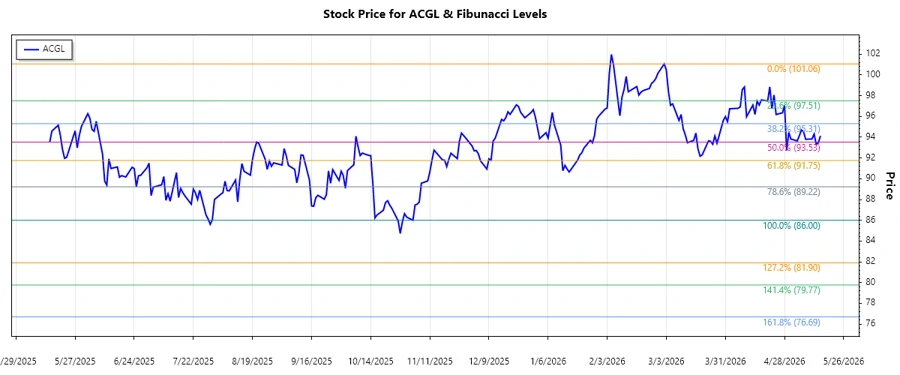
| Trend Type | Downtrend |
| Start Date | 2025-11-12 |
| End Date | 2026-05-14 |
| Highest Point | $101.06 on 2026-02-02 |
| Lowest Point | $86 on 2025-11-03 |
| Fibonacci Level 0.236 | $89.97 |
| Fibonacci Level 0.382 | $91.99 |
| Fibonacci Level 0.5 | $93.53 |
| Fibonacci Level 0.618 | $95.06 |
| Fibonacci Level 0.786 | $97.22 |
| Current Price Analysis | Current price is $94.14; within the 0.382 to 0.5 retracement range. |
| Technical Interpretation | This suggests potential resistance barriers are forming, indicating a cautious approach for current investors. |
Conclusion
Arch Capital Group Ltd. demonstrates a volatile market trajectory, influenced by dynamic global insurance landscapes. The stock is currently in a zone indicating potential resistance, suggesting careful observation for investors. While the stock shows recovery potential, market participants should be wary of overleveraging due to external economic pressures. An understanding of these technical indicators will be crucial for making informed investment decisions, as the interplay of support and resistance levels unfolds.
Smart Data Insight
Master the Perfect Entry & Exit for this Stock
Don't leave your profits to chance. Historically, this stock follows specific seasonal patterns that institutional traders use to maximize returns.
- ✅ Identify the "Golden Buying Window"
- ✅ Avoid high-risk correction cycles
- ✅ Backtested data from the last 20+ years