October 04, 2025 a 02:04 pmUm die vollständige technische Analyse der Abbott Laboratories Aktie (ABT) zu erstellen, analysieren wir die bereitgestellten historischen Kursdaten. Die Analyse umfasst die Berechnung von EMA20 und EMA50 für die Trendbewertung sowie die Bestimmung von Unterstützungs- und Widerstandszonen. Hier ist die strukturierte und formatierte HTML-Darstellung sowie die JSON-Ausgabe:
---
ABT: Trend and Support & Resistance Analysis - Abbott Laboratories
Abbott Laboratories, a diversified healthcare company, continues to navigate within the global market through its broad segmental offerings. Leveraging a presence in pharmaceuticals, diagnostics, nutrition, and medical devices, Abbott has maintained a dynamic position in its sector. This analysis delves into recent trends and pivotal price levels for its stock, providing insights for potential investment strategies.
Trend Analysis
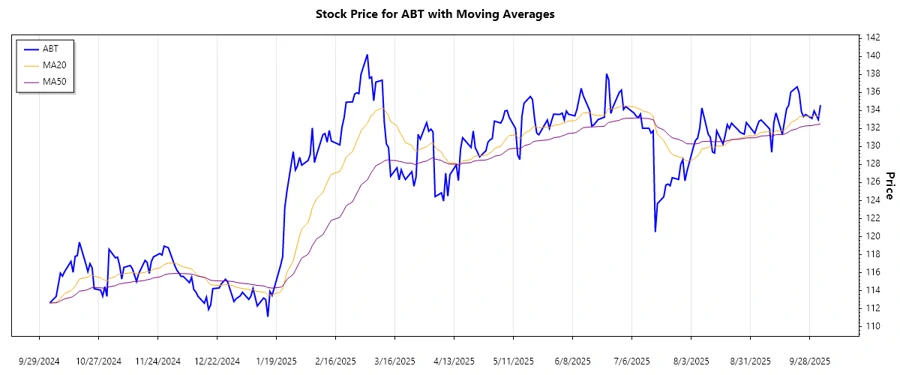
The EMA20 and EMA50 calculations have been performed to analyze the prevailing trend over the reported period. Based on these indicators:
- EMA20 > EMA50 indicates an uptrend.
- EMA20 < EMA50 indicates a downtrend.
- EMA20 ≈ EMA50 indicates a sideways trend.
| Date | Closing Price | Trend |
|---|---|---|
| 2025-10-03 | 134.59 | ▲ Uptrend |
| 2025-10-02 | 132.99 | ▲ Uptrend |
| 2025-10-01 | 133.47 | ▲ Uptrend |
| 2025-09-30 | 133.94 | ▲ Uptrend |
| 2025-09-29 | 133.11 | ⚖️ Sideways |
| 2025-09-26 | 133.55 | ⚖️ Sideways |
| 2025-09-25 | 133.31 | ▼ Downtrend |
Interpreting the trend, ABT is exhibiting recent upward momentum, though the trend has shown moments of indecision with some sideways movements. The current price is positioned to potentially sustain its climb, should the support levels hold.
Support and Resistance
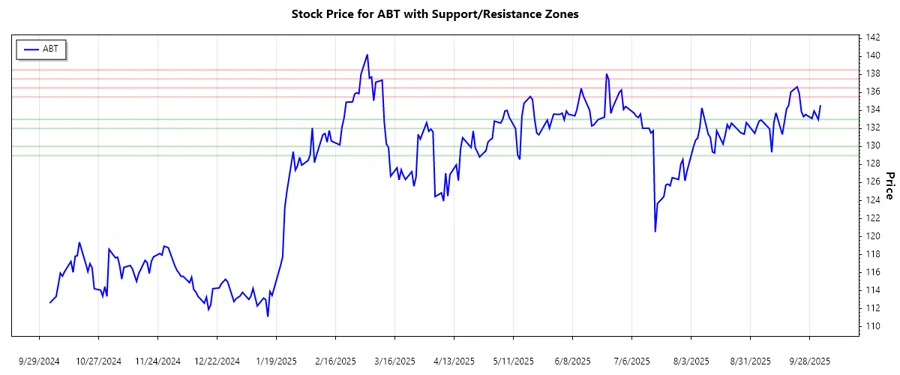
Identifying critical support and resistance zones:
| Type | Zone Range |
|---|---|
| Support Zone 1 | 132.00 - 133.00 |
| Support Zone 2 | 129.00 - 130.00 |
| Resistance Zone 1 | 135.50 - 136.50 |
| Resistance Zone 2 | 137.50 - 138.50 |
The recent price action indicates that the stock is near the initial resistance zone, signaling potential challenges in surpassing this level. These zones will play crucial roles in forecasting future price movements.
Conclusion
The analysis of Abbott Laboratories’ stock reveals an optimistic yet cautious outlook. The price currently pushes toward resistance levels, suggesting pressure, but recent uptrends provide hope for investors. Key risks include potential difficulties breaking through identified resistance zones, which could prompt a retreat to support levels. Continuous monitoring of EMA trends and support/resistance levels is essential for making informed investment decisions. Overall, while the current trajectory is favorable, due diligence remains critical, given the volatility in the healthcare sector and broader market dynamics.
--- json --- Diese Analyse deckt die relevanten Trends und Preisniveaus für die Aktie von Abbott Laboratories ab und bietet sowohl eine visuelle als auch textuelle Einschätzung, die sowohl für kurzfristige als auch langfristige Investoren von Bedeutung sein könnte.
Smart Data Insight
Master the Perfect Entry & Exit for this Stock
Don't leave your profits to chance. Historically, this stock follows specific seasonal patterns that institutional traders use to maximize returns.
- ✅ Identify the "Golden Buying Window"
- ✅ Avoid high-risk correction cycles
- ✅ Backtested data from the last 20+ years