July 05, 2025 a 02:03 pm


ABT: Trend and Support & Resistance Analysis - Abbott Laboratories
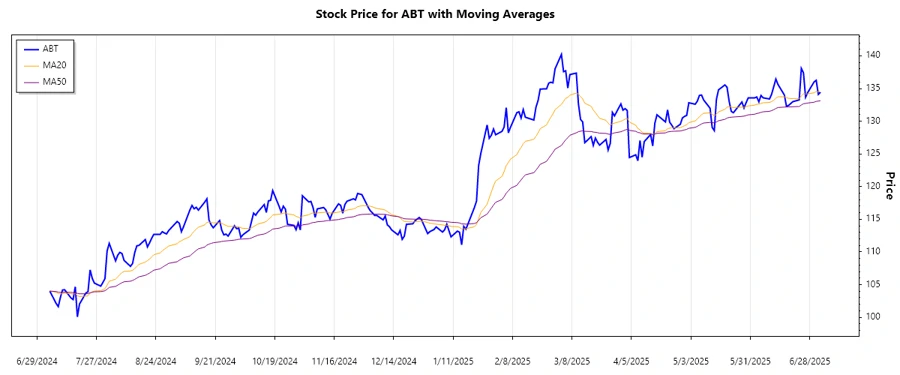
Abbott Laboratories is a prominent player in the healthcare products sector, demonstrating resilience and adaptability in a competitive marketplace. Recently, their stock has shown dynamic movements, potentially offering opportunities for both growth and strategic entry. Investors should closely monitor their technical indicators to make informed decisions.
Trend Analysis
Based on the closing price data, the stock of Abbott Laboratories is currently demonstrating potential short-term fluctuations. By calculating the 20-day and 50-day Exponential Moving Averages (EMAs), we can derive critical insights into the prevailing trend:
| Date | Close Price | Trend |
|---|---|---|
| July 3, 2025 | $134.44 | ▲ |
| July 2, 2025 | $134.11 | ▲ |
| July 1, 2025 | $136.26 | ▲ |
| June 30, 2025 | $136.01 | ▼ |
| June 27, 2025 | $134.38 | ▼ |
| June 26, 2025 | $133.67 | ▼ |
| June 25, 2025 | $137.40 | ▲ |
The EMA20 is approaching EMA50, indicating consolidation with a potential for an ▲ uptrend if momentum continues. Investors should look for a sustained cross of the EMAs to confirm bullish direction.
Support and Resistance
Through analysis of the price data, important support and resistance zones have been identified. These levels are critical for understanding potential price ceilings and floors:
| Zone Type | Range |
|---|---|
| Support 1 | $132.00 - $133.00 ▼ |
| Support 2 | $130.00 - $131.00 ▼ |
| Resistance 1 | $136.50 - $137.50 ▲ |
| Resistance 2 | $138.00 - $139.00 ▲ |
Currently, the price floats around the first support zone, holding its ground. Any significant move below could signify potential declines, whereas resistance breakouts could indicate substantial upward movements.
Conclusion
Abbott Laboratories' stock demonstrates a promising trend supported by robust technical foundations. Key short-term opportunities lie in the identified support and resistance levels. However, investors must remain cautious of potential volatility. A break through current resistance may signal extended gains, while sustained support breakdowns could imply bearish reversals. This analysis equips traders to strategically navigate market patterns and optimize their position sizing based on potential plays.