
June 19, 2025 a 01:15 pm

ABT: Trend and Support & Resistance Analysis - Abbott Laboratories
Abbott Laboratories operates in a diverse and dynamic healthcare environment, providing a range of diagnostic, pharmaceutical, nutritional, and medical device products. As a well-established company with a strong global presence, Abbott has consistently demonstrated resilience and innovation in its sector. The company's wide array of products ensures stability even in fluctuating markets, making it a potentially attractive investment. Recent stock trends and data assessments provide insights into its current market standing and potential future movement.
Trend Analysis
| Date | Close Price | Trend |
|---|---|---|
| 2025-06-18 | 132.41 | ▲ |
| 2025-06-17 | 132.28 | ▼ |
| 2025-06-16 | 134.01 | ▲ |
| 2025-06-13 | 135.62 | ▲ |
| 2025-06-12 | 136.45 | ▲ |
| 2025-06-11 | 135.28 | ▼ |
| 2025-06-10 | 134.13 | ▼ |
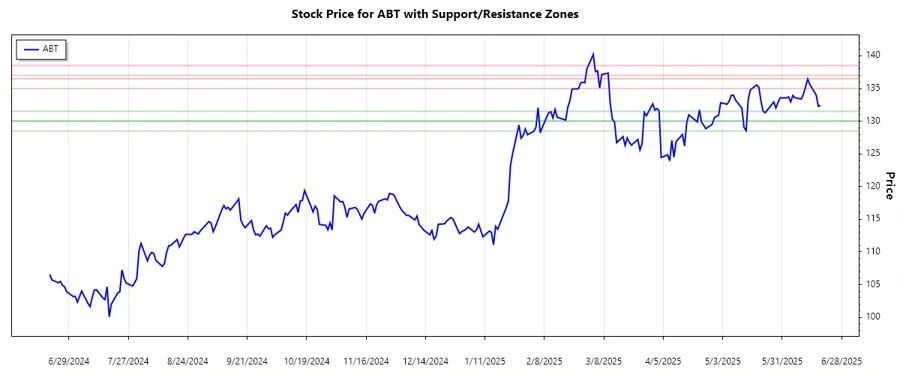
The current data shows a moderately fluctuating trend with a slight upward momentum as indicated by more upward trends in recent days than downward. The EMA20 is closely aligned with EMA50, suggesting a balance with slight upward bias.
Support- and Resistance
| Zone Type | From | To |
|---|---|---|
| Resistance ▲ | 135.00 | 136.50 |
| Second Resistance ▲ | 137.00 | 138.50 |
| Support ▼ | 130.00 | 131.50 |
| Second Support ▼ | 128.50 | 130.00 |
The current stock price hovers around the resistance zone of 135.00 to 136.50, indicating potential upcoming resistance. If the price breaks beyond this level, it may move to the next resistance zone.
Conclusion
Abbott Laboratories maintains a robust position within the healthcare sector, characterized by an innovative and diverse product portfolio that buffers against market volatility. Current analyses indicate a tentative upward trend, though resistance levels present potential hurdles. The interplay of these dynamics highlights the importance of closely monitoring price movements and support/resistance levels for informed decision-making. As long as Abbott navigates these barriers efficiently, it remains an appealing option for investors. However, potential market fluctuations necessitate caution and consideration.
Smart Data Insight
Master the Perfect Entry & Exit for this Stock
Don't leave your profits to chance. Historically, this stock follows specific seasonal patterns that institutional traders use to maximize returns.
- ✅ Identify the "Golden Buying Window"
- ✅ Avoid high-risk correction cycles
- ✅ Backtested data from the last 20+ years