
June 29, 2026 a 10:15 am
ABT: Fibonacci Analysis - Abbott Laboratories
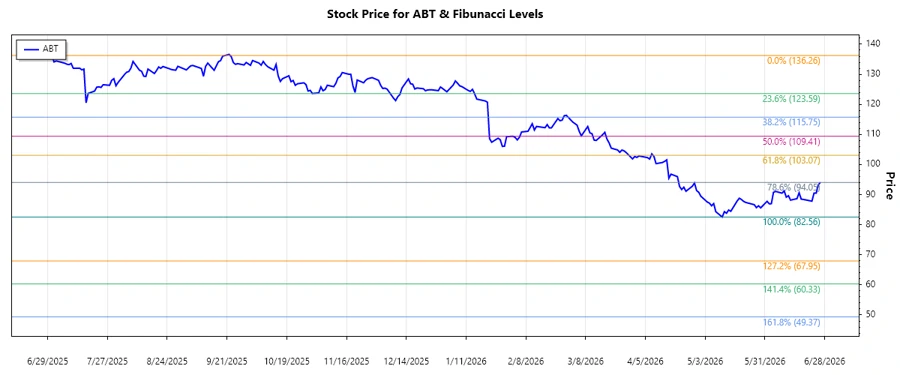
Abbott Laboratories, a global leader in healthcare, has shown a significant downtrend over the observed period. This analysis is centered on identifying potential support and resistance levels using Fibonacci retracement. The most recent price decline provides an opportunity to analyze potential reversal points.
Fibonacci Analysis
| Trend Period | High | Low | Fibonacci Levels | Current Price Zone | Technical Conclusion | ||||||||||||
|---|---|---|---|---|---|---|---|---|---|---|---|---|---|---|---|---|---|
| 2025-06-30 to 2026-06-26 | $136.26 (2025-06-30) | $82.56 (2026-05-11) |
|
0.236 - $94.12 | The current price is near the 0.236 Fibonacci retracement level, suggesting potential support. If this level holds, a rebound could occur. |
Conclusion
The analysis reveals that Abbott Laboratories' stock has been in a downtrend, with the price recently stabilizing near the 0.236 Fibonacci retracement level. If this level holds, it may act as a support, providing a potential buying opportunity for traders anticipating a trend reversal. However, further downward movement could test lower retracement levels. As such, while there is potential for a rebound, caution is advised as the risk remains for continued downside pressure.
Smart Data Insight
Master the Perfect Entry & Exit for this Stock
Don't leave your profits to chance. Historically, this stock follows specific seasonal patterns that institutional traders use to maximize returns.
- ✅ Identify the "Golden Buying Window"
- ✅ Avoid high-risk correction cycles
- ✅ Backtested data from the last 20+ years