December 17, 2025 a 07:31 am

ABT: Dividend Analysis - Abbott Laboratories
Abbott Laboratories demonstrates a strong commitment to dividends with a robust history of 44 consecutive years. Despite a noted suspension in dividend history in 2026, the company strategically aligns payouts with earnings, highlighting financial prudence. Its consistent dividend growth over the years underscores its potential as a reliable income asset within the healthcare sector.
📊 Overview
Abbott Laboratories operates within the healthcare sector, boasting a moderate dividend yield of 1.89%. The current dividend per share stands at 2.22 USD, reflecting its stability over the years. With a dividend history extending over 44 years, it remains a hallmark of reliability, although there was a recent cut or suspension in 2026.
| Detail | Metric |
|---|---|
| Sector | Healthcare |
| Dividend yield | 1.89 % |
| Current dividend per share | 2.22 USD |
| Dividend history | 44 years |
| Last cut or suspension | 2026 |
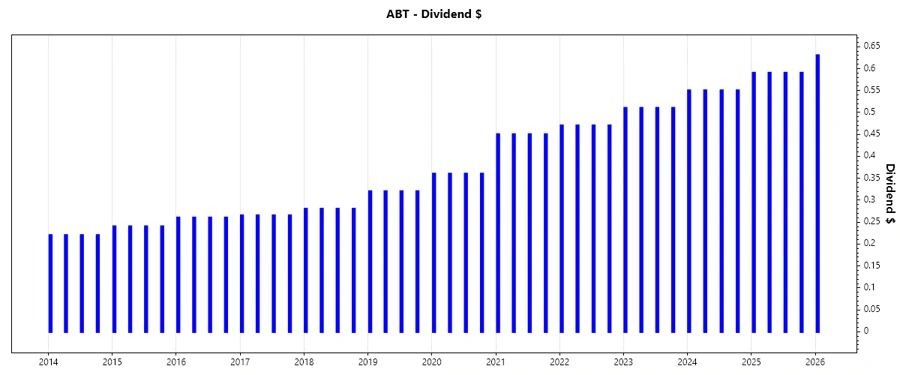
🗣️ Dividend History
The dividend history of Abbott Laboratories is a testament to its consistent financial performance and shareholder value reinforcement. Despite a significant reduction in 2026, the company's dividend payments have shown resilience over decades. This track record is crucial as it provides insights into the company's ability to generate steady cash flows and allocate them efficiently.
| Year | Dividend Per Share (USD) |
|---|---|
| 2026 | 0.63 |
| 2025 | 2.36 |
| 2024 | 2.20 |
| 2023 | 2.04 |
| 2022 | 1.88 |
📈 Dividend Growth
Analyzing the dividend growth over the last three to five years indicates Abbott Laboratories' commitment to enhancing shareholder returns. The growth rates reflect the company's reinvestment potential and its capacity to increase payouts sustainably.
| Time | Growth |
|---|---|
| 3 years | 6.92% |
| 5 years | 11.44% |
The average dividend growth is 11.44% over 5 years. This shows moderate but steady dividend growth.
📉 Payout Ratio
The payout ratio is a significant indicator of a company's dividend-paying ability. Abbott Laboratories maintains a balanced approach with an EPS-based payout ratio of 27.72% and a FCF-based payout ratio of 55.74%, indicating a disciplined financial strategy. These ratios suggest prudent management of payouts relative to earnings and cash flows, ensuring sustainability.
| Key Figure | Ratio |
|---|---|
| EPS-based | 27.72% |
| Free cash flow-based | 55.74% |
✅ Cashflow & Capital Efficiency
An analysis of cashflow and capital efficiency metrics highlights Abbott's operational resilience and efficiency in capital allocation, which are pivotal for sustaining long-term dividend payments. Herein lies the company's ability to convert revenue to cash flow effectively while maintaining strong returns on capital invested.
| Year | 2024 | 2023 | 2022 |
|---|---|---|---|
| Free Cash Flow Yield | 3.24% | 2.65% | 4.05% |
| Earnings Yield | 6.84% | 2.99% | 3.60% |
| CAPEX to Operating Cash Flow | 25.79% | 30.32% | 18.55% |
| Stock-based Compensation to Revenue | 1.60% | 1.61% | 1.57% |
| Free Cash Flow / Operating Cash Flow Ratio | 74.21% | 69.67% | 81.45% |
The data suggests solid cash flow generation relative to capital expenditures, ensuring reliable dividend distributions.
🗣️ Balance Sheet & Leverage Analysis
The balance sheet and leverage analysis of Abbott Laboratories reveal a robust financial position conducive to maintaining dividend payouts. Key ratios indicate the company's capacity to manage debt efficaciously, providing assurance of its long-term solvency and liquid stability.
| Year | 2024 | 2023 | 2022 |
|---|---|---|---|
| Debt-to-Equity | 32.05% | 41.12% | 48.92% |
| Debt-to-Assets | 18.76% | 21.68% | 24.11% |
| Debt-to-Capital | 24.27% | 29.14% | 32.85% |
| Net Debt to EBITDA | 0.71 | 0.85 | 0.68 |
| Current Ratio | 1.67 | 1.64 | 1.63 |
| Quick Ratio | 1.23 | 1.16 | 1.23 |
| Financial Leverage | 1.71 | 1.90 | 2.03 |
The balance sheet reflects robust fundamentals, indicating effective debt management and liquidity positions that safeguard dividend payouts.
🗣️ Fundamental Strength & Profitability
Examining fundamental metrics and profitability reveals Abbott's competitive advantage in generating robust margins and returns. These elements are critical in strengthening the company's long-term dividend outlook.
| Year | 2024 | 2023 | 2022 |
|---|---|---|---|
| Return on Equity | 28.12% | 14.83% | 18.90% |
| Return on Assets | 16.46% | 7.82% | 9.31% |
| Margins: Net | 31.95% | 14.27% | 15.88% |
| EBIT | 18.15% | 18.35% | 19.75% |
| EBITDA | 25.83% | 26.44% | 27.23% |
| Gross Profit | 50.83% | 49.96% | 51.14% |
| Research & Development to Revenue | 6.73% | 6.78% | 6.53% |
The strength in fundamental and profitability metrics positions Abbott favorably for sustained dividend growth and shareholder value creation.
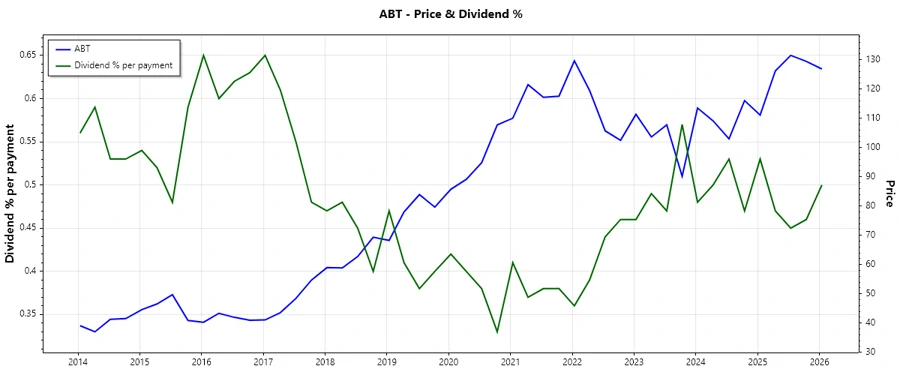
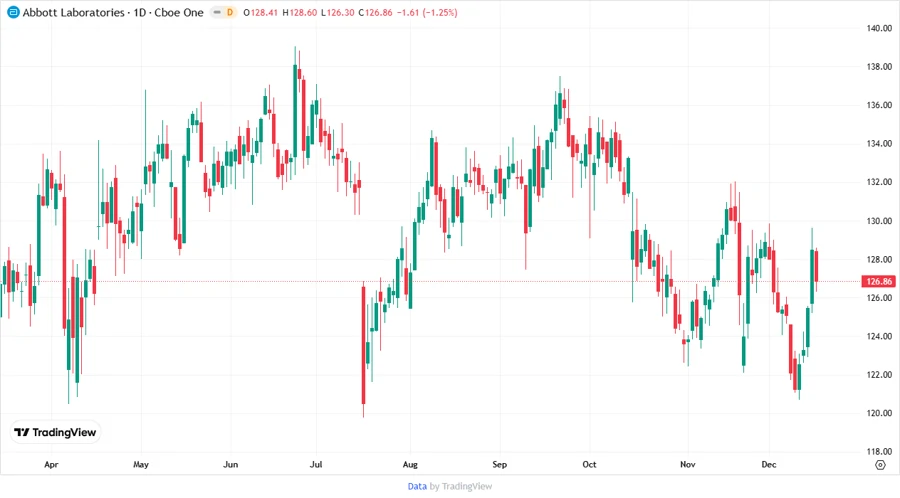
📈 Price Development
🗒️ Dividend Scoring System
| Category | Score | Score Bar |
|---|---|---|
| Dividend yield | 3 | |
| Dividend Stability | 4 | |
| Dividend growth | 4 | |
| Payout ratio | 4 | |
| Financial stability | 5 | |
| Dividend continuity | 3 | |
| Cashflow Coverage | 5 | |
| Balance Sheet Quality | 5 |
Total Score: 33/40
🔍 Rating
Abbott Laboratories offers a compelling dividend profile characterized by strong fundamental and financial metrics. With a solid dividend history and disciplined payout strategy, the company positions itself as a reliable choice for income-focused investors. While careful monitoring of recent dividend adjustments is advised, its financial stability suggests continuity and potential future increments in shareholder returns.