November 14, 2025 a 11:31 am

ABT: Dividend Analysis - Abbott Laboratories
Abbott Laboratories offers a robust dividend profile, characterized by over four decades of consistent payouts. With a current dividend yield of 1.82% and a growth history spanning 43 consecutive years, Abbott represents stability in dividend distribution. The company's strategic financial management has resulted in a balanced payout that combines both shareholder return and reinvestment for sustained growth. Despite a past cut in 2013, the dividends have steadily recovered and increased since.
📊 Overview
Abbott Laboratories operates in a diverse sector, ensuring revenue stability from various segments. The current dividend yield stands at 1.82%, complemented by a dividend per share of $2.22. With a 43-year history of dividend payouts and the last cut in 2013, Abbott's dividend reliability is notable.
| Sector | Dividend Yield | Current Dividend Per Share | Dividend History | Last Cut or Suspension |
|---|---|---|---|---|
| Healthcare | 1.82% | $2.22 | 43 years | 2013 |
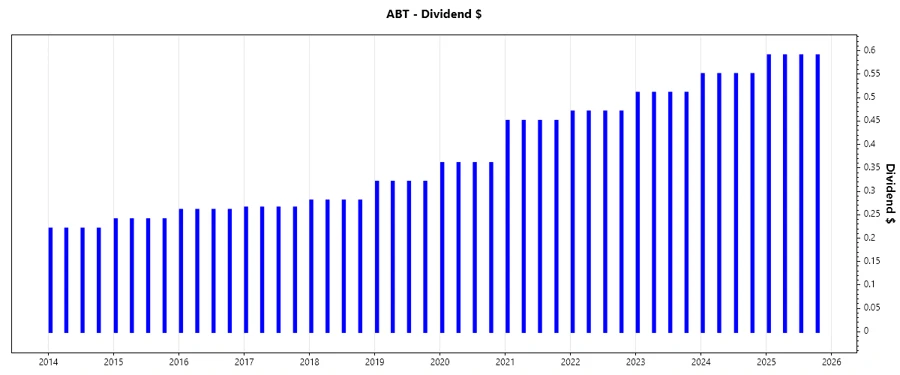
📈 Dividend History
Analyzing the historical dividend data provides vital insights into a company's commitment to shareholder returns. Abbott's uninterrupted dividend growth and manageable payout rhythm underscore its fiscal prudence over four decades.
| Year | Dividend Per Share |
|---|---|
| 2025 | $2.36 |
| 2024 | $2.20 |
| 2023 | $2.04 |
| 2022 | $1.88 |
| 2021 | $1.80 |
📉 Dividend Growth
Dividend growth is a critical metric, illustrating a company's capacity to increase payouts consistently. Abbott's growth over three years is 6.92%, and 11.44% over five years, reflecting a steady appreciation in dividends.
| Time | Growth |
|---|---|
| 3 years | 6.92% |
| 5 years | 11.44% |
The average dividend growth is 11.44% over 5 years. This shows moderate but steady dividend growth.
Payout Ratio
The payout ratio is pivotal in gauging the sustainability of dividends. Abbott's EPS payout ratio of 27.72% and FCF payout ratio of 56.91% signal a well-managed dividend policy that maintains enough capital for innovation and expansion alongside shareholder returns.
| Key Figure | Ratio |
|---|---|
| EPS-based | 27.72% |
| Free cash flow-based | 56.91% |
Cashflow & Capital Efficiency
The strength of Abbott's financial health is reflected in its robust free cash flow yield and efficient capital allocation. Metrics like CAPEX to Operating Cash Flow and Stock-based Compensation to Revenue are monitored to ensure capital is not only sufficient for current operations but also optimized for future growth.
| Metric | 2024 | 2023 | 2022 |
|---|---|---|---|
| Free Cash Flow Yield | 3.24% | 2.65% | 4.05% |
| Earnings Yield | 6.84% | 3.00% | 3.60% |
| CAPEX to Operating Cash Flow | 25.79% | 30.33% | 18.55% |
| Stock-based Compensation to Revenue | 1.60% | 1.61% | 1.57% |
| Free Cash Flow / Operating Cash Flow Ratio | 74.21% | 69.67% | 81.45% |
Balance Sheet & Leverage Analysis
An optimal balance sheet is foundational to sustaining dividends and financial health. Abbott's debt-to-equity and quick ratios emphasize its prudent financial management and liquidity.
| Metric | 2024 | 2023 | 2022 |
|---|---|---|---|
| Debt-to-Equity | 0.32 | 0.41 | 0.49 |
| Debt-to-Assets | 0.19 | 0.22 | 0.24 |
| Debt-to-Capital | 0.24 | 0.29 | 0.33 |
| Net Debt to EBITDA | 0.71 | 0.85 | 0.68 |
| Current Ratio | 1.67 | 1.64 | 1.63 |
| Quick Ratio | 1.23 | 1.16 | 1.23 |
| Financial Leverage | 1.71 | 1.90 | 2.03 |
Fundamental Strength & Profitability
Abbott's comprehensive profitability ratios, such as Return on Equity (ROE) and margins, demonstrate its efficient use of equity and revenue to generate returns, sustaining its expansive market presence.
| Metric | 2024 | 2023 | 2022 |
|---|---|---|---|
| Return on Equity | 28.12% | 14.83% | 18.90% |
| Return on Assets | 16.46% | 7.82% | 9.31% |
| Net Profit Margin | 31.95% | 14.27% | 15.88% |
| EBIT Margin | 18.15% | 18.35% | 19.75% |
| EBITDA Margin | 25.83% | 26.44% | 27.23% |
| Gross Margin | 50.83% | 49.96% | 51.14% |
| R&D to Revenue | 6.73% | 6.78% | 6.53% |
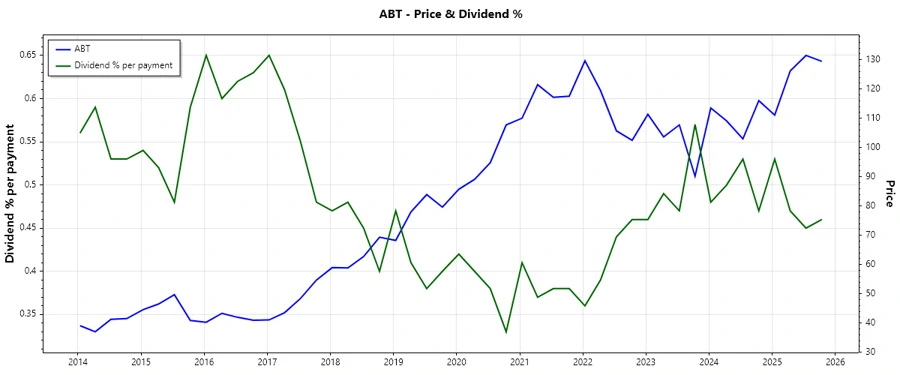
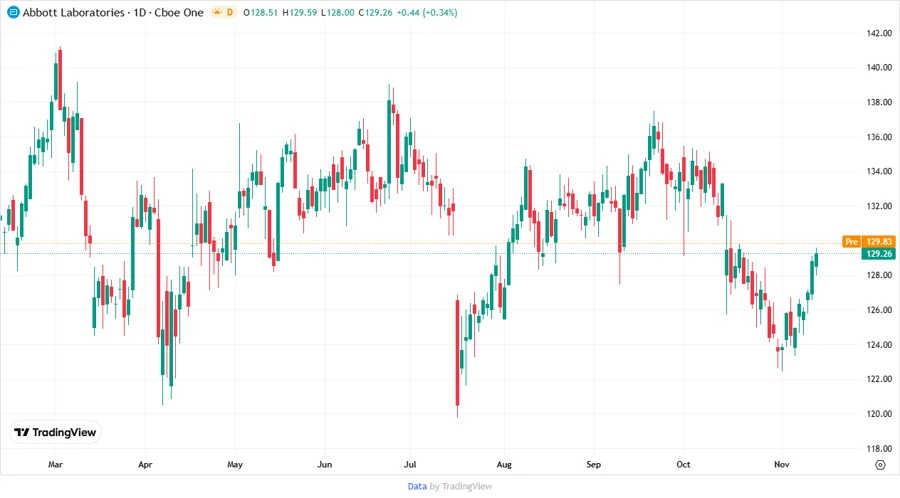
Price Development
Dividend Scoring System
| Criteria | Rating | Score |
|---|---|---|
| Dividend yield | 4 | |
| Dividend Stability | 5 | |
| Dividend Growth | 4 | |
| Payout Ratio | 3 | |
| Financial Stability | 4 | |
| Dividend Continuity | 5 | |
| Cashflow Coverage | 3 | |
| Balance Sheet Quality | 4 |
Total Score: 32/40
Rating
Abbott Laboratories offers a compelling dividend profile characterized by stability and a moderate yield. The combination of solid financial metrics and growth-focused strategies presents a strong case for investors seeking both consistent income and capital appreciation. Recommendation: Strong Buy, with a focus on its long-term dividend growth and stability.
Smart Data Insight
Master the Perfect Entry & Exit for this Stock
Don't leave your profits to chance. Historically, this stock follows specific seasonal patterns that institutional traders use to maximize returns.
- ✅ Identify the "Golden Buying Window"
- ✅ Avoid high-risk correction cycles
- ✅ Backtested data from the last 20+ years