August 27, 2025 a 03:31 am

ABT: Dividend Analysis - Abbott Laboratories
Abbott Laboratories demonstrates a stable and robust dividend profile, supported by a long history of consistent payments. With a current dividend yield of approximately 1.76% and a history of 43 consecutive years of dividend growth, Abbott exhibits both reliability and steady growth potential. Investors may find this attractive, given the impressive dividend growth performance over the last five years.
📊 Overview
Abbott Laboratories operates within the healthcare sector, boasting a current dividend yield of 1.76% with a dividend per share of $2.22. The company has proudly sustained its dividends for 43 years, indicating strong commitment and stability, with no last cuts or suspensions on record.
| Detail | Value |
|---|---|
| Sector | Healthcare |
| Dividend yield | 1.76% |
| Current dividend per share | 2.22 USD |
| Dividend history | 43 years |
| Last cut or suspension | None |
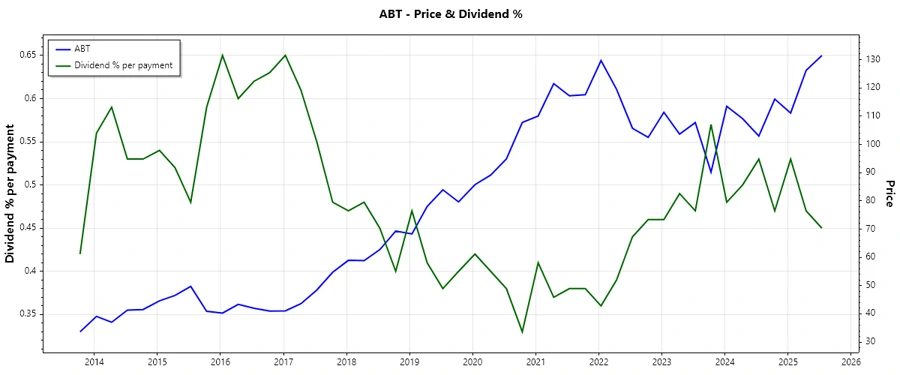
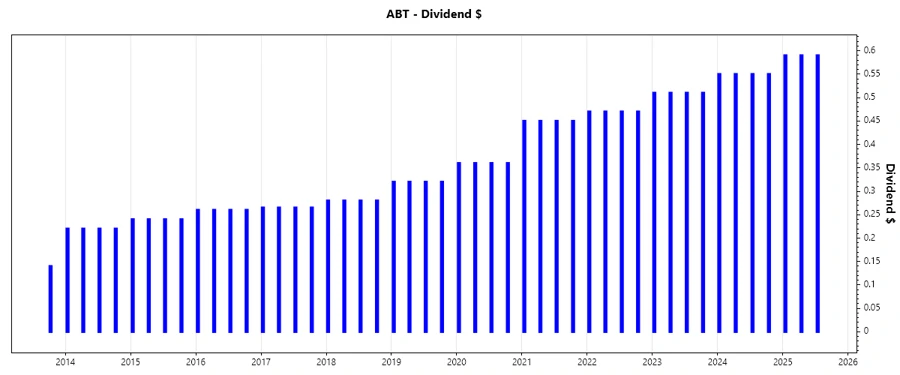
📉 Dividend History
Understanding Abbott’s dividend history reveals its dedication to returning capital to shareholders as a priority. The consistency over the years highlights the company's financial health and management's capability.
| Year | Dividend per Share |
|---|---|
| 2025 | $1.77 |
| 2024 | $2.20 |
| 2023 | $2.04 |
| 2022 | $1.88 |
| 2021 | $1.80 |
📈 Dividend Growth
Evaluating the company's dividend growth is crucial as it demonstrates Abbott's strategic approach to increasing shareholder value over time. Notably, the company's growth figures reinforce its commitment to enhancing dividends consistently.
| Time | Growth |
|---|---|
| 3 years | 6.91% |
| 5 years | 11.44% |
The average dividend growth is 11.44% over 5 years. This shows moderate but steady dividend growth, reflecting optimism for continuous shareholder returns.
🗣️ Payout Ratio
Abbott maintains a judicious balance between capital retention for growth and distributing profits to shareholders, as reflected in the payout ratios. These metrics provide insights into the sustainability of its dividend payments.
| Key Figure | Ratio |
|---|---|
| EPS-based | 27.58% |
| Free cash flow-based | 57.92% |
The EPS payout ratio of 27.58% and FCF payout ratio of 57.92% are considered safe, leaving ample room to cover expenses and future dividends.
💵 Cashflow & Capital Efficiency
Robust cash flow generation and effective capital management are vital to sustaining and growing dividends. These figures shed light on Abbott's ability to finance dividends from operational efficiency.
| Year | 2024 | 2023 | 2022 |
|---|---|---|---|
| Free Cash Flow Yield | 3.24% | 2.65% | 4.05% |
| Earnings Yield | 6.84% | 2.99% | 3.60% |
| CAPEX to Operating Cash Flow | 25.79% | 30.33% | 18.55% |
| Stock-based Compensation to Revenue | 1.60% | 1.61% | 1.57% |
| Free Cash Flow / Operating Cash Flow Ratio | 74.21% | 69.67% | 81.45% |
The consistency in free cash flow and earnings yield emphasizes Abbott's smooth capital management and strong capability in funding dividend distribution from operation-generated capital.
🧾 Balance Sheet & Leverage Analysis
Having a healthy balance sheet is critical for long-term dividend sustainability. Abbott’s leverage ratios underline its financial stability and risk profile.
| Year | 2024 | 2023 | 2022 |
|---|---|---|---|
| Debt-to-Equity | 32.05% | 41.12% | 48.92% |
| Debt-to-Assets | 18.76% | 21.68% | 24.11% |
| Debt-to-Capital | 24.27% | 29.14% | 32.85% |
| Net Debt to EBITDA | 0.71 | 0.85 | 0.68 |
| Current Ratio | 1.67 | 1.63 | 1.63 |
| Quick Ratio | 1.23 | 1.16 | 1.23 |
| Financial Leverage | 1.71 | 1.90 | 2.03 |
A lowering debt-to-equity ratio is reassuring, elucidating an improving financial stance and a solid underpinning for maintaining dividend payouts in turbulent times.
📜 Fundamental Strength & Profitability
Abbott's capacity to convert revenue into profit resonates through its strong profitability ratios, illustrating how efficiently the company deploys its resources.
| Year | 2024 | 2023 | 2022 |
|---|---|---|---|
| Return on Equity | 28.12% | 14.83% | 18.90% |
| Return on Assets | 16.46% | 7.82% | 9.31% |
| Net Profit Margin | 31.95% | 14.27% | 15.88% |
| EBIT Margin | 18.15% | 18.35% | 19.75% |
| EBITDA Margin | 25.83% | 26.44% | 27.23% |
| Gross Margin | 50.83% | 49.96% | 51.14% |
| R&D to Revenue | 6.73% | 6.78% | 6.53% |
High and stable returns on equity and assets attest to Abbott's adeptness in utilizing equity and asset bases to generate substantial profit, supporting continued shareholder value creation.
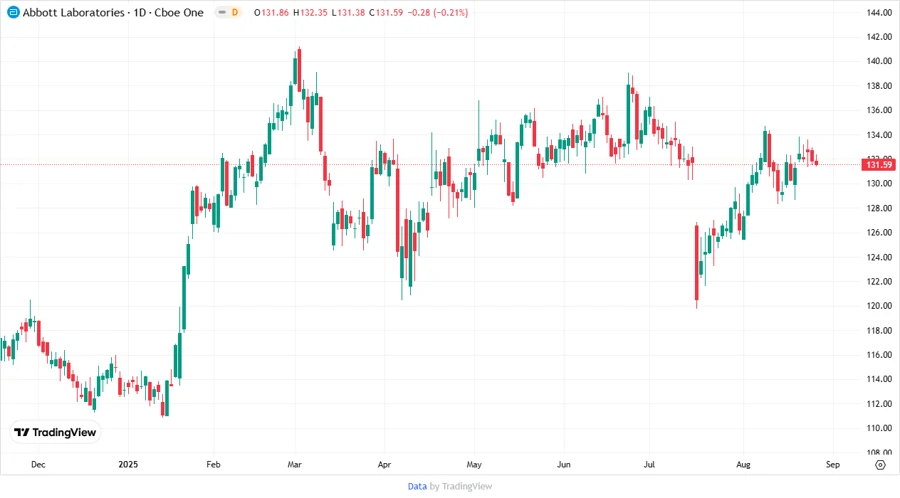
📈 Price Development
🎯 Dividend Scoring System
| Criterion | Assessment | Score |
|---|---|---|
| Dividend yield | 1.76% | 3.5/5 |
| Dividend stability | 43 years | 4.5/5 |
| Dividend growth | 11.44% (5y) | 4/5 |
| Payout ratio | EPS 27.58%, FCF 57.92% | 4/5 |
| Financial stability | Strong | 4.25/5 |
| Dividend continuity | 43 years | 4.75/5 |
| Cashflow coverage | Good | 3.75/5 |
| Balance sheet quality | Solid | 4/5 |
Total: 32.75/40
✅ Rating
Abbott Laboratories stands as a sound choice for dividend-focused investors, showcasing a resilient dividend policy, moderate growth, and robust financial stability. It demonstrates an exemplary track record, and continues to be a reliable component of a diversified investment portfolio.
Smart Data Insight
Master the Perfect Entry & Exit for this Stock
Don't leave your profits to chance. Historically, this stock follows specific seasonal patterns that institutional traders use to maximize returns.
- ✅ Identify the "Golden Buying Window"
- ✅ Avoid high-risk correction cycles
- ✅ Backtested data from the last 20+ years