
July 22, 2026 a 04:03 am
ABNB: Trend and Support & Resistance Analysis - Airbnb, Inc.
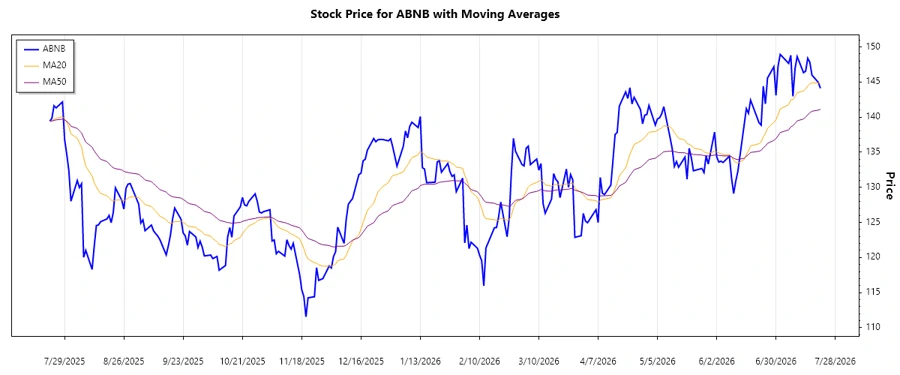
Airbnb, Inc. has shown significant momentum in the market with recent price stability, attracting investors. However, it is crucial to monitor key support and resistance levels to anticipate potential market movements. The trend direction provides insights into the short-term situation, useful for making informed trading decisions.
Trend Analysis
| Date | Close Price | Trend |
|---|---|---|
| 2026-07-21 | 144.1 | ▲ |
| 2026-07-20 | 144.94 | ▲ |
| 2026-07-17 | 145.98 | ▲ |
| 2026-07-16 | 147.8 | ▲ |
| 2026-07-15 | 148.38 | ▲ |
| 2026-07-14 | 146.54 | ▲ |
| 2026-07-13 | 146.33 | ▲ |
Based on the recent EMAs, the market is showing an upward trend, suggesting a bullish sentiment. This is supported by higher highs in recent days.
Support- and Resistance
| Zone Type | From | To | Direction |
|---|---|---|---|
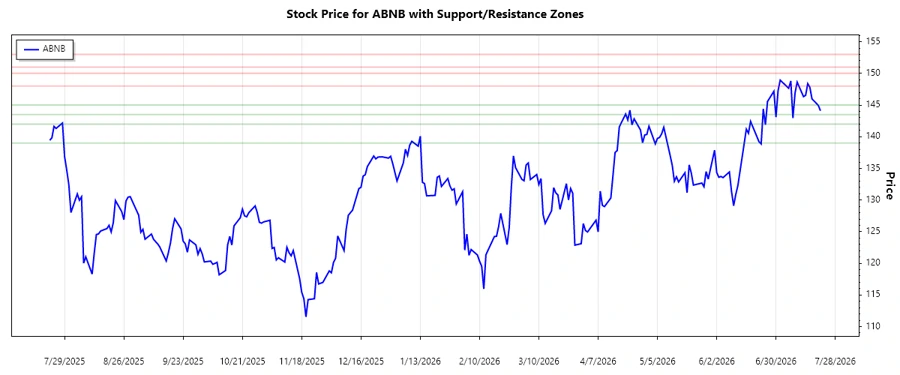
| Support | 139.00 | 142.00 | ▼ |
| Support | 143.50 | 145.00 | ▼ |
| Resistance | 148.00 | 150.00 | ▲ |
| Resistance | 151.00 | 153.00 | ▲ |
The current price is approaching a resistance zone, indicating potential pullback unless a breakout occurs. Staying above support levels could confirm the continuation of the trend.
Conclusion
The current upward trend in Airbnb, Inc.'s stock price reflects positive investor sentiment and bullish market conditions. If the stock maintains its momentum and breaks through resistance levels, it could suggest further growth opportunities. However, investors should remain cautious of any reversals at resistance zones. Monitoring these technical indicators can provide valuable insights for future market behavior and ensure informed investment decisions.
Smart Data Insight
Master the Perfect Entry & Exit for this Stock
Don't leave your profits to chance. Historically, this stock follows specific seasonal patterns that institutional traders use to maximize returns.
- ✅ Identify the "Golden Buying Window"
- ✅ Avoid high-risk correction cycles
- ✅ Backtested data from the last 20+ years