May 04, 2026 a 11:43 am

ABNB: Fundamental Ratio Analysis - Airbnb, Inc.
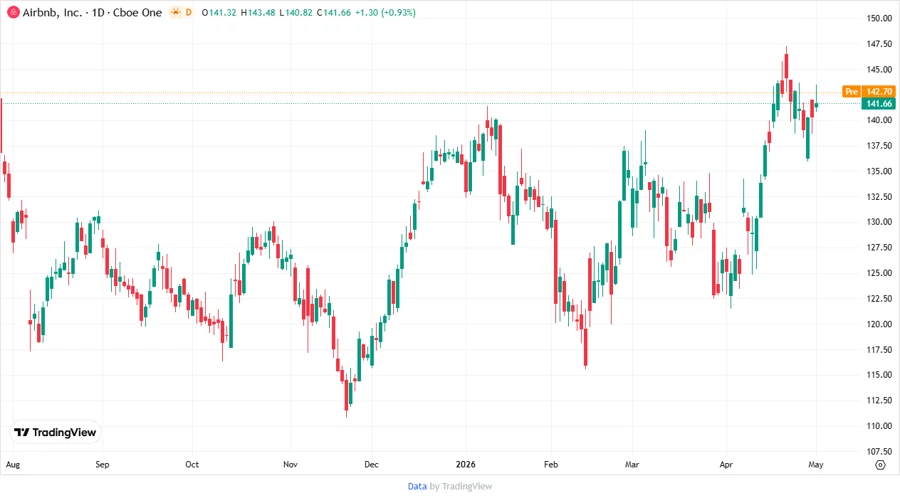
Airbnb, Inc. operates a platform connecting hosts and guests for booking accommodations and experiences around the globe. The company's innovative marketplace model has driven its global reach. Despite some volatility in the travel industry, Airbnb continues to exhibit a strong potential for growth and innovation.
Fundamental Rating
The current fundamental ratings suggest a stable but not extraordinary performance. While the Return on Equity and Assets are strong, there is room for improvement in Debt and Price related ratios.
| Category | Score | Visual |
|---|---|---|
| Discounted Cash Flow | 3 | |
| Return On Equity | 5 | |
| Return On Assets | 5 | |
| Debt To Equity | 2 | |
| Price To Earnings | 2 | |
| Price To Book | 1 |
Historical Rating
A snapshot of the historical ratings indicates a consistent trend in the fundamental scores.
| Date | Overall | DCF | ROE | ROA | D/E | P/E | P/B |
|---|---|---|---|---|---|---|---|
| 2026-05-01 | 3 | 3 | 5 | 5 | 2 | 2 | 1 |
| Historical | 0 | 3 | 5 | 5 | 2 | 2 | 1 |
Analyst Price Targets
Analyst estimates show a diverse perception, with a substantial range between the high and low targets, yet the consensus is moderately optimistic.
| High | Low | Median | Consensus |
|---|---|---|---|
| $185 | $107 | $147.5 | $145.44 |
Analyst Sentiment
The general sentiment among analysts appears cautious, with significant numbers recommending to hold, although buys outweigh sells.
| Recommendation | Count | Visual |
|---|---|---|
| Strong Buy | 0 | |
| Buy | 20 | |
| Hold | 21 | |
| Sell | 3 | |
| Strong Sell | 0 |
Conclusion
Airbnb, Inc. displays solid fundamentals with strong returns on equity and assets, though its debt-to-equity and valuation ratios suggest caution. The company's potential for innovation and growth remains a key driver, enthused by resilience and adaptability in the travel industry. Analyst sentiment is mixed but leans more towards a hold perspective. Potential investors should weigh the growth potential against existing risks. Overall, Airbnb remains a noteworthy contender in the travel service sector.
Smart Data Insight
Master the Perfect Entry & Exit for this Stock
Don't leave your profits to chance. Historically, this stock follows specific seasonal patterns that institutional traders use to maximize returns.
- ✅ Identify the "Golden Buying Window"
- ✅ Avoid high-risk correction cycles
- ✅ Backtested data from the last 20+ years