June 21, 2026 a 06:00 pm
ABBV: Fundamental Ratio Analysis - AbbVie Inc.
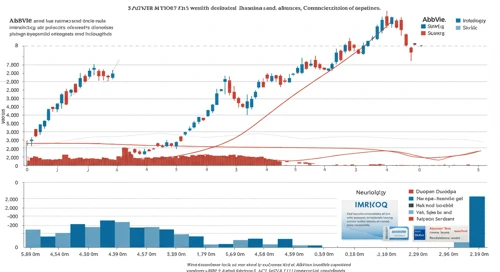
AbbVie Inc., a key player in the biopharmaceutical industry, continues to showcase robust performance with its diverse therapeutic portfolio. With recent scoring indicating stability in core financial indicators, the company maintains its strategic position in the healthcare sector. The fundamental analysis suggests a balanced risk-reward profile for potential investors.
Fundamental Rating
AbbVie Inc.'s fundamental analysis indicates relative stability, with consistent scores across key financial metrics. The company's commitment to innovation and market expansion contributes to its strong market position.
| Category | Score | Visualization |
|---|---|---|
| Discounted Cash Flow | 4 | |
| Return On Equity | 4 | |
| Return On Assets | 4 | |
| Debt To Equity | 1 | |
| Price To Earnings | 1 | |
| Price To Book | 1 |
Historical Rating
Reviewing recent historical scores shows minor fluctuation, indicating steady management of financial factors over time.
| Date | Overall | DCF | ROE | ROA | D/E | P/E | P/B |
|---|---|---|---|---|---|---|---|
| 2026-06-18 | 3 | 4 | 4 | 4 | 1 | 1 | 1 |
| Previous | 0 | 4 | 4 | 4 | 1 | 1 | 1 |
Analysts' Price Targets
Current analyst projections highlight potential growth, with a median target suggesting room for price appreciation.
| Target | Price |
|---|---|
| High | $298 |
| Low | $223 |
| Median | $259 |
| Consensus | $256.92 |
Analysts' Sentiment
Analyst sentiment remains generally positive, with a consensus towards buying, though moderated by a notable number of hold recommendations.
| Recommendation | Count | Percentage |
|---|---|---|
| Strong Buy | 0 | |
| Buy | 28 | |
| Hold | 12 | |
| Sell | 1 | |
| Strong Sell | 0 |
Conclusion
AbbVie Inc. presents a strong fundamental profile, underscored by its robust therapeutic offerings and market strategies. While the financials suggest certain areas for improvement, particularly in debt management, the company's overall stability and industry positioning remain attractive. Analyst projections further support potential value appreciation, offering a balanced investment opportunity. Investors should, however, remain cognizant of market conditions and potential sector-specific risks.
Smart Data Insight
Master the Perfect Entry & Exit for this Stock
Don't leave your profits to chance. Historically, this stock follows specific seasonal patterns that institutional traders use to maximize returns.
- ✅ Identify the "Golden Buying Window"
- ✅ Avoid high-risk correction cycles
- ✅ Backtested data from the last 20+ years