May 21, 2026 a 05:15 am
ABBV: Fibonacci Analysis - AbbVie Inc.
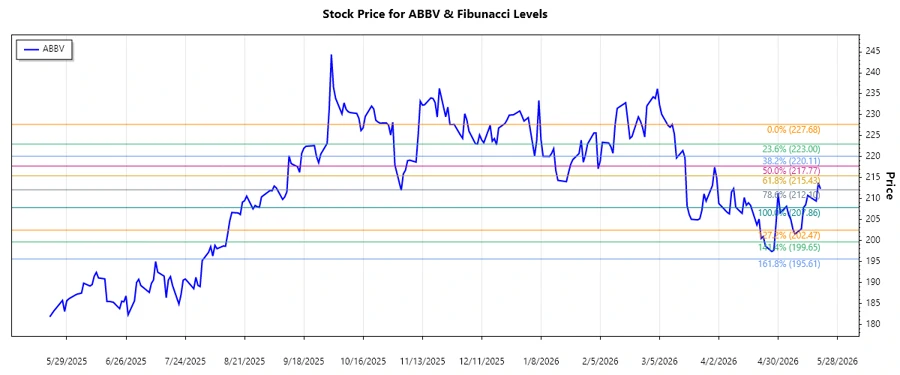
The stock of AbbVie Inc. (ABBV) has been experiencing fluctuations in the recent months, creating opportunities for technical analysis. The recent market data suggests significant movements, and Fibonacci retracement levels can offer insights into potential support and resistance levels. With AbbVie's diverse pharmaceutical portfolio, its stock's performance remains a key focus for investors considering both technical and fundamental factors.
Fibonacci Analysis
| Analysis Details | Value |
|---|---|
| Trend Start Date | 2026-03-16 |
| Trend End Date | 2026-05-20 |
| High Price Date & Value | 2026-03-11, $227.68 |
| Low Price Date & Value | 2026-05-12, $207.86 |
| Fibonacci Level 0.236 | $212.32 |
| Fibonacci Level 0.382 | $215.98 |
| Fibonacci Level 0.5 | $218.28 |
| Fibonacci Level 0.618 | $220.58 |
| Fibonacci Level 0.786 | $223.45 |
| Current Zone | 0.236 |
| Interpretation | The current price suggests it is in the early stages of recovery, aligning with the 0.236 Fibonacci level. |
Conclusion
Analyzing AbbVie Inc.'s stock through technical perspectives reveals that there has been a clear declining trend, with recent prices rebounding from low points around the 0.236 Fibonacci retracement level. This presents a potential for further upward momentum if the prices capitalize on support provided by these retracement levels. However, the risk of fluctuating market conditions remains, demanding close monitoring. Potential signs of resistance could await further up at 0.382 or higher Fibonacci levels. Investors should consider this technical backdrop as part of a broader market analysis strategy to capture potential reversal opportunities.
Smart Data Insight
Master the Perfect Entry & Exit for this Stock
Don't leave your profits to chance. Historically, this stock follows specific seasonal patterns that institutional traders use to maximize returns.
- ✅ Identify the "Golden Buying Window"
- ✅ Avoid high-risk correction cycles
- ✅ Backtested data from the last 20+ years