
July 16, 2026 a 03:31 am

ABBV: Dividend Analysis - AbbVie Inc.
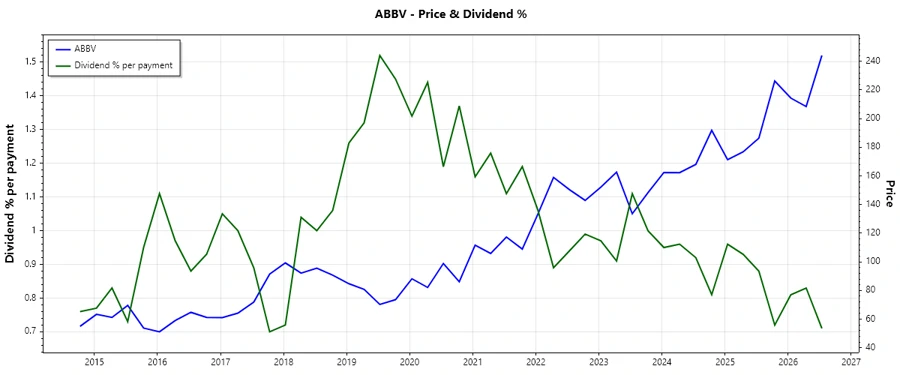
AbbVie Inc., a renowned player in the biopharmaceutical sector, signifies a strong dedication to returning value to shareholders through dividends. The company's robust dividend history and growth highlight its stable financial health. Investors should note its attractive dividend yield and consistent dividend increases despite economic fluctuations. Though there are concerns regarding payout ratios, the company's strategic management of dividends demonstrates confidence in its long-term operations.
📊 Overview
AbbVie Inc. offers an appealing dividend profile essential for income-focused investors. Its reliable dividend history underscores its steadfast allocative strategy favoring shareholder returns.
| Metric | Value |
|---|---|
| Sector | Biopharmaceuticals |
| Dividend yield | 2.80% |
| Current dividend per share | $6.55 |
| Dividend history | 14 years |
| Last cut or suspension | None |
🗣️ Dividend History
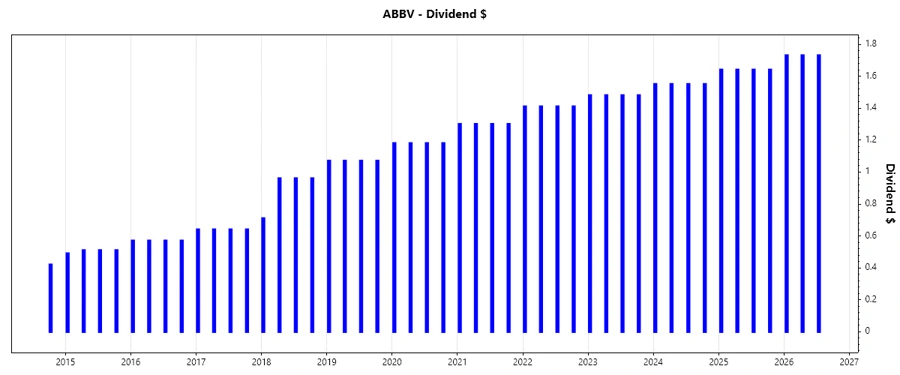
Analyzing AbbVie's dividend history reveals its resilience and commitment to maintaining payouts, a critical factor for dependability in dividend investments. Such consistency assures investors of sustainable returns over time.
| Year | Dividend per Share (USD) |
|---|---|
| 2026 | $5.19 |
| 2025 | $6.56 |
| 2024 | $6.20 |
| 2023 | $5.92 |
| 2022 | $5.64 |
📈 Dividend Growth
Dividend growth is pivotal in evaluating a company’s future payout potential. AbbVie exhibits substantial growth, signifying robust financial prospects and effective revenue allocations.
| Time | Growth |
|---|---|
| 3 years | 5.17% |
| 5 years | 6.81% |
The average dividend growth is 6.81% over 5 years. This shows moderate but steady dividend growth.
⚠️ Payout Ratio
Payout ratios reflect the balance between earnings distribution and reinvestment for growth. AbbVie's EPS-based ratio suggests a capital-intensive strategy, whereas a favorable FCF-based ratio implies prudent financial management.
| Key figure | Ratio |
|---|---|
| EPS-based | 319.16% |
| Free cash flow-based | 55.44% |
The exceptionally high EPS-based ratio is concerning in terms of earnings sustainability, though the FCF-based ratio is more manageable.
✅ Cashflow & Capital Efficiency
AbbVie’s cash flow metrics highlight effective capital allocation and fiscal discipline. Key ratios demonstrate the company’s ability to support dividends sustainably, assure liquidity, and foster investment returns.
| Metric | 2023 | 2024 | 2025 |
|---|---|---|---|
| Free Cash Flow Yield | 8.05% | 5.67% | 4.38% |
| Earnings Yield | 1.77% | 1.36% | 1.04% |
| CAPEX to Operating Cash Flow | 3.40% | 5.18% | 6.38% |
| Stock-based Compensation to Revenue | 1.37% | 1.62% | 1.56% |
| Free Cash Flow / Operating Cash Flow Ratio | 96.60% | 94.82% | 93.62% |
The data reveals stable cash flows capable of ensuring sustained dividend distributions.
📉 Balance Sheet & Leverage Analysis
The financial structure highlights AbbVie's leverage and risk management strategies. Despite high debt ratios, controlled short-term liquidity is sufficient given operational cash flow strength.
| Metric | 2023 | 2024 | 2025 |
|---|---|---|---|
| Debt-to-Equity | 5.80 | 20.40 | -21.12 |
| Debt-to-Assets | 44.63% | 50.19% | 51.56% |
| Debt-to-Capital | 85.30% | 95.33% | 104.97% |
| Net Debt to EBITDA | 2.75 | 4.18 | 3.62 |
| Current Ratio | 0.87 | 0.66 | 0.67 |
| Quick Ratio | 0.76 | 0.55 | 0.56 |
Leverage is high, raising caution, yet consistent profitability underscores debt service capacity without immediate liquidity issues.
💼 Fundamental Strength & Profitability
Assessing AbbVie’s fundamentals reveals robustness in return profiles and efficient margin control, indicating strategic excellence and operational acumen.
| Metric | 2023 | 2024 | 2025 |
|---|---|---|---|
| Return on Equity | 46.94% | 128.66% | -129.24% |
| Return on Assets | 3.61% | 3.17% | 3.15% |
| Return on Invested Capital | 9.56% | 8.85% | 12.97% |
| Net Margin | 8.95% | 7.59% | 6.91% |
| EBIT Margin | 15.60% | 11.58% | 15.52% |
| EBITDA Margin | 31.61% | 26.47% | 28.82% |
| Gross Margin | 62.41% | 69.99% | 70.24% |
| R&D to Revenue | 14.13% | 22.71% | 14.87% |
High returns and maintained profitability indicate strong value generation, though fluctuating output must be monitored.
Price Development
📢 Dividend Scoring System
| Category | Score | Score Bar |
|---|---|---|
| Dividend yield | 4 | |
| Dividend Stability | 5 | |
| Dividend growth | 4 | |
| Payout ratio | 2 | |
| Financial stability | 3 | |
| Dividend continuity | 5 | |
| Cashflow Coverage | 4 | |
| Balance Sheet Quality | 3 |
Total Score: 30/40
Final Rating
AbbVie Inc. presents a robust dividend narrative backed by substantial yield and growth potential. Though high payout ratios suggest caution, solid financials support an overall positive outlook. Recommended for investors seeking consistent income with a moderate risk tolerance.
Smart Data Insight
Master the Perfect Entry & Exit for this Stock
Don't leave your profits to chance. Historically, this stock follows specific seasonal patterns that institutional traders use to maximize returns.
- ✅ Identify the "Golden Buying Window"
- ✅ Avoid high-risk correction cycles
- ✅ Backtested data from the last 20+ years