May 01, 2026 a 03:31 am


ABBV: Dividend Analysis - AbbVie Inc.
AbbVie Inc. presents a compelling dividend profile with a moderate yield, robust history, and steady growth. While the company has maintained an uninterrupted dividend history for 14 years, its EPS payout ratio suggests a careful examination of sustainability is warranted. The dividend growth over the last few years indicates AbbVie’s commitment to returning value to shareholders, despite some financial pressures.
📊 Overview
AbbVie Inc. operates within the healthcare sector, which is notable for consistent demand and growth potential. The company's current dividend yield stands at 3.23%, indicating a compelling opportunity for income-focused investors. Furthermore, AbbVie has a remarkable dividend history of 14 years without cuts or suspensions, illustrating its dedication to shareholder returns.
| Metric | Value |
|---|---|
| Sector | Healthcare |
| Dividend Yield | 3.23% |
| Current Dividend Per Share | 6.55 USD |
| Dividend History | 14 years |
| Last Cut or Suspension | None |
📉 Dividend History
AbbVie’s dividend history reflects a steady increase, enhancing the confidence of long-term investors. This track record signifies a reliable income stream, crucial during market fluctuations. The absence of any cuts in recent years further strengthens its dividend reputation.
| Year | Dividend Per Share (USD) |
|---|---|
| 2026 | 3.46 |
| 2025 | 6.56 |
| 2024 | 6.20 |
| 2023 | 5.92 |
| 2022 | 5.64 |
📈 Dividend Growth
Understanding the dividend growth rate is essential for evaluating the potential future income from an investment in AbbVie. The company has achieved a 5.17% growth over the last three years and 6.81% over five years, suggesting a steady upward trajectory.
| Time | Growth |
|---|---|
| 3 years | 5.17 % |
| 5 years | 6.81 % |
The average dividend growth is 6.81% over 5 years. This shows moderate but steady dividend growth, reassuring investors seeking long-term capital appreciation.
✅ Payout Ratio
The payout ratio is an essential measure of dividend sustainability. AbbVie’s EPS-based payout ratio is significantly high at 319.16%, indicating the dividends paid exceed the earnings generated. However, the FCF-based ratio is a more moderate 61.93%, suggesting the payout is covered by cash flows, reducing the immediate risk of a dividend cut.
| Key Figure | Ratio (%) |
|---|---|
| EPS-based | 319.16% |
| Free Cash Flow-based | 61.93% |
While the EPS payout ratio of 319.16% appears unsustainable, the more reliable FCF payout ratio of 61.93% suggests that AbbVie can sustain its dividends using current cash flows.
💵 Cashflow & Capital Efficiency
Cash flow stability and the effective use of capital are critical for sustained dividend distribution and business growth. AbbVie demonstrates a robust free cash flow yield and maintains effective capital expenditure management, as evidenced by the CAPEX to Operating Cash Flow ratio.
| Metric | 2023 | 2024 | 2025 |
|---|---|---|---|
| Free Cash Flow Yield | 8.05% | 5.67% | 4.38% |
| Earnings Yield | 1.8% | 1.36% | 1.04% |
| CAPEX to Operating Cash Flow | 3.4% | 5.18% | 6.38% |
| Stock-based Compensation to Revenue | 1.38% | 1.62% | 1.56% |
| Free Cash Flow / Operating Cash Flow Ratio | 96.6% | 94.8% | 93.6% |
The high free cash flow yield highlights AbbVie's efficient cash generation capacity, critical for maintaining and potentially increasing future dividends.
📖 Balance Sheet & Leverage Analysis
Evaluating AbbVie’s balance sheet and leverage ratio informs the risk profile and financial stability of the company. While current and quick ratios suggest potential liquidity challenges, robust cash flow ratios mitigate short-term liquidity concerns.
| Metric | 2023 | 2024 | 2025 |
|---|---|---|---|
| Debt-to-Equity | 5.80 | 20.40 | -21.12 |
| Debt-to-Assets | 44.63% | 50.19% | 51.56% |
| Debt-to-Capital | 85.30% | 95.33% | 104.97% |
| Net Debt to EBITDA | 2.75 | 4.18 | 3.62 |
| Current Ratio | 0.87 | 0.66 | 0.67 |
| Quick Ratio | 0.76 | 0.55 | 0.55 |
| Financial Leverage | 13.00 | 40.65 | -40.97 |
The leverage ratios indicate higher financial risks, but effective use of debt for expansion could offer long-term benefits if well-managed.
📈 Fundamental Strength & Profitability
Strong fundamentals ensure the sustainability of AbbVie’s dividend payments. Despite challenges, profitability metrics like Return on Assets and Margins indicate operational efficiency and profitability.
| Metric | 2023 | 2024 | 2025 |
|---|---|---|---|
| Return on Equity | 47% | 1.29% | -1.29% |
| Return on Assets | 3.61% | 3.17% | 3.15% |
| Net Profit Margin | 8.9% | 7.6% | 6.9% |
| EBIT Margin | 15.60% | 11.58% | 15.52% |
| EBITDA Margin | 31.61% | 26.47% | 28.82% |
| Gross Margin | 62.42% | 70.00% | 70.24% |
| R&D to Revenue | 14.13% | 22.71% | 14.87% |
AbbVie’s margins and ROA indicate steady profitability, bolstered by strategic R&D investments that ensure long-term growth prospects.
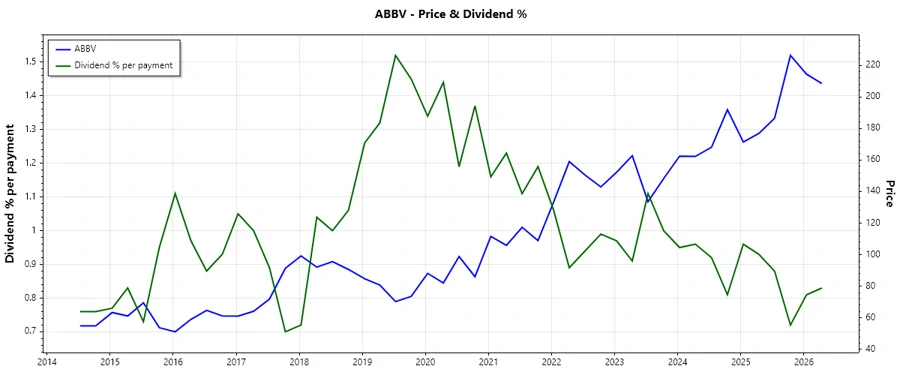
💹 Price Development
🗣️ Dividend Scoring System
| Category | Score | Representation |
|---|---|---|
| Dividend yield | 3 | |
| Dividend Stability | 4 | |
| Dividend growth | 4 | |
| Payout ratio | 2 | |
| Financial stability | 2 | |
| Dividend continuity | 5 | |
| Cashflow Coverage | 4 | |
| Balance Sheet Quality | 3 |
Total Score: 27/40
🌟 Rating
AbbVie Inc. receives a positive evaluation due to its strong dividend track record, moderate growth, and consistent cash flow coverage. However, potential investors should be cautious of its high EPS-based payout ratio and leverage ratios. With an overall score of 27 out of 40, AbbVie remains an attractive choice for dividend-focused investors willing to tolerate higher financial leverage for the potential of continued dividend growth.
Smart Data Insight
Master the Perfect Entry & Exit for this Stock
Don't leave your profits to chance. Historically, this stock follows specific seasonal patterns that institutional traders use to maximize returns.
- ✅ Identify the "Golden Buying Window"
- ✅ Avoid high-risk correction cycles
- ✅ Backtested data from the last 20+ years