October 24, 2025 a 03:31 am

ABBV: Dividend Analysis - AbbVie Inc.
AbbVie Inc., a leading biopharmaceutical company, presents a complex dividend profile for analysis. With a dividend yield of approximately 2.90%, the company has maintained 13 years of continuous dividend payments, demonstrating its commitment to returning value to shareholders. However, its high EPS-based payout ratio suggests potential sustainability concerns despite solid free cash flow metrics.
📊 Overview
The overview table highlights key dividend metrics for AbbVie Inc., providing insight into the company's sector placement, dividend yield, and historical performance in returning shareholder value.
| Metric | Value |
|---|---|
| Sector | Biopharmaceuticals |
| Dividend Yield | 2.90% |
| Current Dividend Per Share | 6.23 USD |
| Dividend History | 13 years |
| Last Cut or Suspension | None |
📈 Dividend History
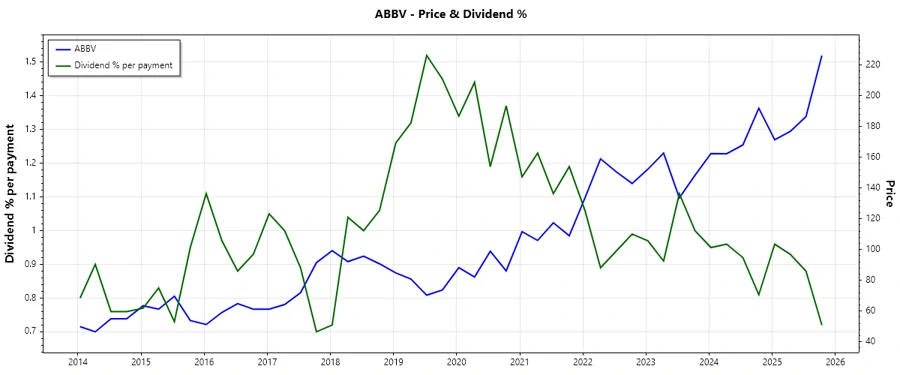
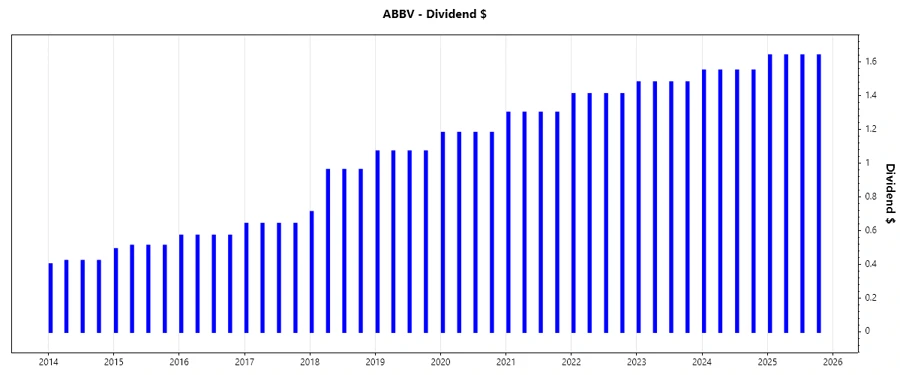
AbbVie's dividend history is a testament to its reliable distributions over the years. This sustainability is crucial for investor confidence, particularly for income-focused portfolios.
| Year | Dividend Per Share (USD) |
|---|---|
| 2025 | 6.56 |
| 2024 | 6.20 |
| 2023 | 5.92 |
| 2022 | 5.64 |
| 2021 | 5.20 |
📈 Dividend Growth
Understanding AbbVie's dividend growth is essential as it indicates the potential for future income increases. Over the last five years, the company has demonstrated an average growth rate of approximately 7.69%.
| Time | Growth |
|---|---|
| 3 years | 6.04% |
| 5 years | 7.69% |
The average dividend growth is 7.69% over 5 years. This shows moderate but steady dividend growth.
🗣️ Payout Ratio
Payout ratios are critical indicators of dividend sustainability. AbbVie's EPS-based payout ratio is substantially high at 293.01%, indicating that dividends exceed earnings, which could be risky in the long term.
| Key Figure | Ratio |
|---|---|
| EPS-based | 293.01% |
| Free Cash Flow-based | 60.36% |
The high EPS payout ratio suggests potential for financial strain, whereas the more modest FCF ratio indicates solid operational cash flow backing the dividends.
📉 Cashflow & Capital Efficiency
The analysis of cash flow and capital efficiency ratios provides insight into AbbVie's ability to generate cash and use capital efficiently. This is crucial for assessing the financial health and dividend coverage of the company.
| Year | 2024 | 2023 | 2022 |
|---|---|---|---|
| Free Cash Flow Yield | 5.67% | 8.05% | 8.47% |
| Earnings Yield | 1.36% | 1.77% | 4.14% |
| CAPEX to Operating Cash Flow | 5.14% | 3.40% | 2.79% |
| Stock-based Compensation to Revenue | 2.42% | 1.38% | 1.16% |
| Free Cash Flow / Operating Cash Flow Ratio | 94.82% | 96.60% | 97.21% |
| Return on Invested Capital | 10.21% | 9.56% | 14.02% |
The data indicates robust cash generation and efficient capital utilization, though declining return on invested capital warrants monitoring.
📊 Balance Sheet & Leverage Analysis
A thorough examination of AbbVie's balance sheet and leverage reveals its debt levels and liquidity. This understanding is vital to evaluate its capability to meet financial obligations and support dividend distributions.
| Year | 2024 | 2023 | 2022 |
|---|---|---|---|
| Debt-to-Equity | 20.40 | 5.80 | 3.72 |
| Debt-to-Assets | 50.19% | 44.63% | 46.25% |
| Debt-to-Capital | 95.33% | 85.30% | 78.82% |
| Net Debt to EBITDA | 4.18 | 2.75 | 2.27 |
| Current Ratio | 0.66 | 0.87 | 0.96 |
| Quick Ratio | 0.55 | 0.76 | 0.84 |
| Financial Leverage | 40.65 | 13.00 | 8.04 |
The elevated debt metrics highlight financial leverage that may pose risks, yet liquidity ratios remain a concern given their relatively low levels.
✅ Fundamental Strength & Profitability
Assessing profitability and fundamental strength helps investors understand the effectiveness of AbbVie's management in generating profits from its assets and equity.
| Year | 2024 | 2023 | 2022 |
|---|---|---|---|
| Return on Equity | 128.66% | 46.94% | 68.60% |
| Return on Assets | 3.17% | 3.61% | 8.53% |
| Net Margin | 7.59% | 8.95% | 20.39% |
| EBIT Margin | 11.58% | 15.60% | 27.06% |
| EBITDA Margin | 26.47% | 31.61% | 41.64% |
| Gross Margin | 70.00% | 62.42% | 70.00% |
| Research & Development to Revenue | 22.41% | 14.13% | 11.21% |
The profitability metrics remain strong, although the decreasing returns could present issues if the trend continues.
📈 Price Development
📊 Dividend Scoring System
| Criteria | Score (1-5) | Visual |
|---|---|---|
| Dividend Yield | 3 | |
| Dividend Stability | 4 | |
| Dividend Growth | 3 | |
| Payout Ratio | 2 | |
| Financial Stability | 2 | |
| Dividend Continuity | 5 | |
| Cashflow Coverage | 4 | |
| Balance Sheet Quality | 2 |
Total Score: 25/40
✅ Rating
The overall rating suggests that AbbVie Inc. is a generally consistent dividend-paying entity with some underlying financial vulnerabilities. Prospective investors should weigh the relatively high yield against potential sustainability challenges posed by the current payout ratio metrics. Nonetheless, the robust dividend history offers a positive indicator of commitment to returning value to shareholders.
Smart Data Insight
Master the Perfect Entry & Exit for this Stock
Don't leave your profits to chance. Historically, this stock follows specific seasonal patterns that institutional traders use to maximize returns.
- ✅ Identify the "Golden Buying Window"
- ✅ Avoid high-risk correction cycles
- ✅ Backtested data from the last 20+ years