October 05, 2025 a 07:46 am

ABBV: Dividend Analysis - AbbVie Inc.
AbbVie Inc. (ABBV) is a formidable player in the pharmaceutical industry, known for its consistent dividend payouts and strong market presence. With a market capitalization exceeding $413 billion and a robust dividend history, AbbVie continues to attract income-focused investors. Despite high EPS-based payout ratios, the company's financial health supports steady dividend growth, making it an appealing choice for long-term investment portfolios.
Overview 📊
AbbVie Inc. operates within the healthcare sector, known for its resilience and innovation. The company's dividend yield of 2.80% reflects its focus on returning value to shareholders while sustaining growth. With a current dividend per share of $6.23 and an unbroken dividend history of 13 years, AbbVie demonstrates a commitment to income distribution with no recent cuts or suspensions.
| Sector | Dividend Yield (%) | Current Dividend Per Share (USD) | Dividend History (Years) | Last Cut or Suspension |
|---|---|---|---|---|
| Healthcare | 2.80 | 6.23 | 13 | None |
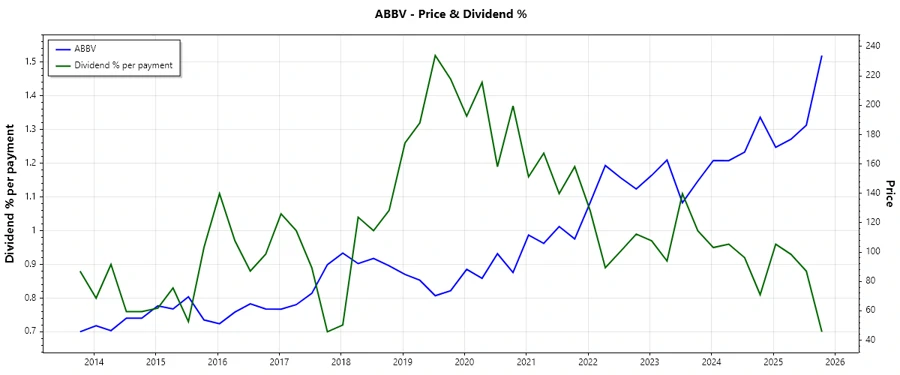
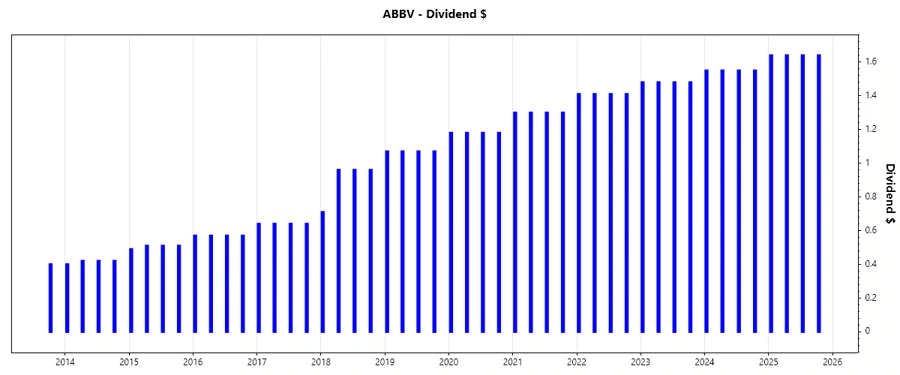
Dividend History 📉
A consistent dividend history is crucial for evaluating a company's commitment to returning revenue to shareholders. AbbVie's uninterrupted dividend payments over 13 years showcase its financial stability and dedication to rewarding investors.
| Year | Dividend per Share (USD) |
|---|---|
| 2025 | 6.56 |
| 2024 | 6.20 |
| 2023 | 5.92 |
| 2022 | 5.64 |
| 2021 | 5.20 |
Dividend Growth 📈
Monitoring dividend growth helps assess a company's capacity to increase shareholder returns over time. AbbVie's dividend growth of 6% over the last three years and 7.7% over five years indicates a stable increase in shareholder wealth.
| Time | Growth (%) |
|---|---|
| 3 years | 6.0 |
| 5 years | 7.7 |
The average dividend growth is 7.7% over five years. This shows moderate but steady dividend growth.
Payout Ratio ⚠️
Payout ratios indicate the proportion of earnings or cash flow used for dividend payments, crucial for sustainability analysis.
| Key Figure Ratio | Value (%) |
|---|---|
| EPS-based | 293.01 |
| Free Cash Flow-based | 60.36 |
While a high EPS-based payout ratio of 293% signals potential sustainability concerns, the FCF-based ratio of 60% suggests dividends are well-covered by cash flow, reflecting prudent financial management.
Cashflow & Capital Efficiency 💸
Cash flow metrics illuminate a company's financial flexibility and investment efficiency, crucial for ongoing growth and shareholder returns.
| Year | 2022 | 2023 | 2024 |
|---|---|---|---|
| Free Cash Flow Yield | 8.47% | 8.05% | 5.67% |
| Earnings Yield | 4.14% | 1.77% | 1.36% |
| CAPEX to Operating Cash Flow | 2.79% | 3.40% | 5.18% |
| Stock-based Compensation to Revenue | 1.16% | 1.38% | 1.62% |
| Free Cash Flow / Operating Cash Flow Ratio | 97.21% | 96.60% | 94.82% |
AbbVie's ability to maintain high cash flow yields showcases financial resilience, enhanced by efficient capital allocation strategies, ensuring continued dividend capacity.
Balance Sheet & Leverage Analysis 📊
Debt ratios are pivotal in gauging financial stability and risk exposure, informing investment and operational risk decisions.
| Year | 2022 | 2023 | 2024 |
|---|---|---|---|
| Debt-to-Equity | 3.72 | 5.80 | 20.40 |
| Debt-to-Assets | 46.25% | 44.63% | 50.19% |
| Debt-to-Capital | 78.82% | 85.30% | 95.33% |
| Net Debt to EBITDA | 2.27 | 2.75 | 4.52 |
| Current Ratio | 0.96 | 0.87 | 0.66 |
| Quick Ratio | 0.84 | 0.76 | 0.55 |
AbbVie's evolving debt profile suggests increased leverage, necessitating careful monitoring. Its ratios indicate adequate liquidity management amidst expanding debt levels.
Fundamental Strength & Profitability 📈
Profitability metrics, such as margins and returns, highlight management efficacy in generating wealth relative to resources employed.
| Year | 2022 | 2023 | 2024 |
|---|---|---|---|
| Return on Equity | 68.60% | 46.94% | 128.66% |
| Return on Assets | 8.53% | 3.61% | 3.17% |
| Net Margin | 20.39% | 8.95% | 7.59% |
| EBIT Margin | 27.06% | 15.60% | 11.58% |
| Gross Margin | 70.00% | 62.42% | 69.99% |
| R&D to Revenue | 11.21% | 14.13% | 22.71% |
The robust profit margins reinforce AbbVie's operational agility, fortified by strategic R&D investments that yield competitive advantages.
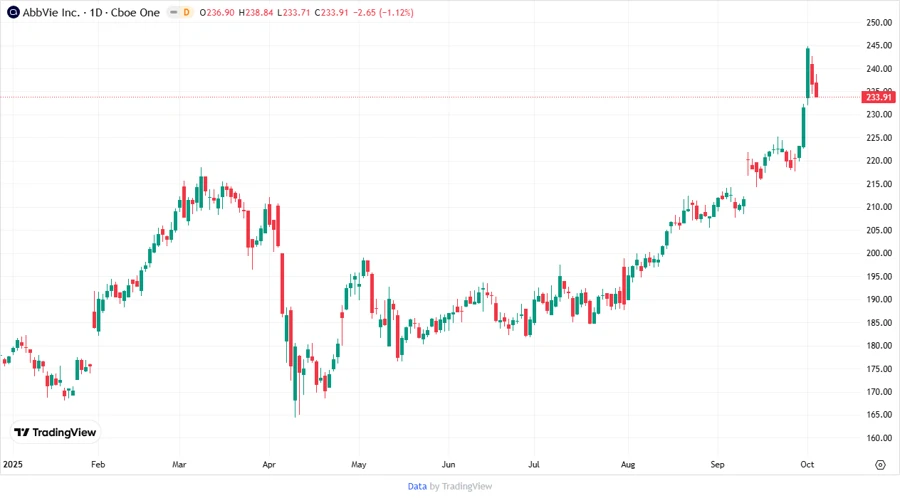
Price Development 📈
Dividend Scoring System ✅
| Category | Score | Score Bar |
|---|---|---|
| Dividend Yield | 4 | |
| Dividend Stability | 5 | |
| Dividend Growth | 4 | |
| Payout Ratio | 3 | |
| Financial Stability | 3 | |
| Dividend Continuity | 5 | |
| Cashflow Coverage | 4 | |
| Balance Sheet Quality | 3 |
Overall Score: 31/40
Rating 🗣️
AbbVie presents a compelling dividend investment opportunity, with stable and notable dividend yields supported by its financial health. While high leverage warrants attention, the strategic allocation of resources and remarkable dividend history underscore AbbVie’s robust investment profile.
Smart Data Insight
Master the Perfect Entry & Exit for this Stock
Don't leave your profits to chance. Historically, this stock follows specific seasonal patterns that institutional traders use to maximize returns.
- ✅ Identify the "Golden Buying Window"
- ✅ Avoid high-risk correction cycles
- ✅ Backtested data from the last 20+ years