July 23, 2025 a 12:46 pm


ABBV: Dividend Analysis - AbbVie Inc.
AbbVie Inc. is a renowned pharmaceutical company with a substantial market presence. Known for its consistent dividend payments, AbbVie has been rewarding its investors steadily over the years. This analysis will delve into AbbVie's dividend profile, capital efficiency, and financial stability, providing a comprehensive view of its investor appeal.
Overview 📊
AbbVie has demonstrated increased attention to investor returns through dividends, an integral component of its shareholder value proposition. The company's consistent dividend yield offers a relatively stable income stream, essential for income-oriented investors.
| Details | Value |
|---|---|
| Sector | Pharmaceuticals |
| Dividend yield | 3.47 % |
| Current dividend per share | 6.23 USD |
| Dividend history | 13 years |
| Last cut or suspension | None |
Dividend History 📈
AbbVie's dividend history showcases the company's commitment to shareholder returns, providing a sense of financial health and future growth prospects. Understanding this history is critical as it forms the backbone of investor trust and expectations.
| Year | Dividend per Share (USD) |
|---|---|
| 2025 | 4.92 |
| 2024 | 6.20 |
| 2023 | 5.92 |
| 2022 | 5.64 |
| 2021 | 5.20 |
Dividend Growth 📉
Dividend growth serves as a crucial indicator of a company's long-term financial stability and its potential for rewarding shareholders. It reflects well-managed operations and confident management outlook.
| Time | Growth |
|---|---|
| 3 years | 6.04 % |
| 5 years | 7.69 % |
The average dividend growth is 7.69 % over 5 years. This shows moderate but steady dividend growth.
Payout Ratio ✅
Analyzing the payout ratio is essential to understand a company's sustainability in paying dividends. It indicates the proportion of earnings paid out as dividends, impacting future growth capability.
| Key figure | Ratio |
|---|---|
| EPS-based | 262.66 % |
| Free cash flow-based | 71.56 % |
The EPS-based payout ratio is excessively high at 262.66 %, suggesting a dependence on debt or reserves for dividend payments, whereas the FCF-based payout ratio of 71.56 % is more sustainable, indicating robust operational cash flow.
Cashflow & Capital Efficiency 🔍
The following indicators of cash flow and capital efficiency are vital in assessing a company’s ability to generate cash and efficiently allocate capital resources.
| Year | 2022 | 2023 | 2024 |
|---|---|---|---|
| Free Cash Flow Yield | 8.47 % | 8.05 % | 5.67 % |
| Earnings Yield | 4.14 % | 1.77 % | 1.36 % |
| CAPEX to Operating Cash Flow | 2.79 % | 3.40 % | 5.18 % |
| Stock-based Compensation to Revenue | 1.16 % | 1.38 % | 1.62 % |
| Free Cash Flow / Operating Cash Flow Ratio | 97.21 % | 96.60 % | 94.82 % |
The cash flow and capital efficiency metrics illustrate a favorable free cash flow yield and efficient capital allocation, suggesting strong operational stability and capital management.
Balance Sheet & Leverage Analysis 📊
Balance sheet metrics are instrumental in evaluating a company's leverage, financial health, and ability to withstand economic downturns.
| Year | 2022 | 2023 | 2024 |
|---|---|---|---|
| Debt-to-Equity | 366.70 % | 573.21 % | 2019.37 % |
| Debt-to-Assets | 45.58 % | 44.08 % | 49.68 % |
| Debt-to-Capital | 78.57 % | 85.15 % | 95.28 % |
| Net Debt to EBITDA | 1.72 | 2.69 | 4.13 |
| Current Ratio | 0.96 | 0.87 | 0.66 |
| Quick Ratio | 0.84 | 0.76 | 0.55 |
| Financial Leverage | 8.04 | 13.00 | 40.65 |
The leverage ratios imply a highly leveraged balance sheet, underscored by a substantial debt-to-equity ratio, suggesting that debt funds a large portion of the company's assets, which could raise risks during financial downturns.
Fundamental Strength & Profitability 🔍
By analyzing profitability metrics and return ratios, we can identify AbbVie’s efficiency in generating profits from its resources.
| Year | 2022 | 2023 | 2024 |
|---|---|---|---|
| Return on Equity | 68.60 % | 46.94 % | 128.66 % |
| Return on Assets | 8.53 % | 3.61 % | 3.17 % |
| Margins: Net | 20.39 % | 8.95 % | 7.59 % |
| EBIT | 27.06 % | 15.85 % | 11.58 % |
| EBITDA | 54.13 % | 31.86 % | 26.47 % |
| Gross | 70.00 % | 62.42 % | 69.99 % |
| Research & Development to Revenue | 11.21 % | 15.56 % | 14.76 % |
AbbVie's steady profitability and robust return rates highlight its operational efficiency and effective cost management.
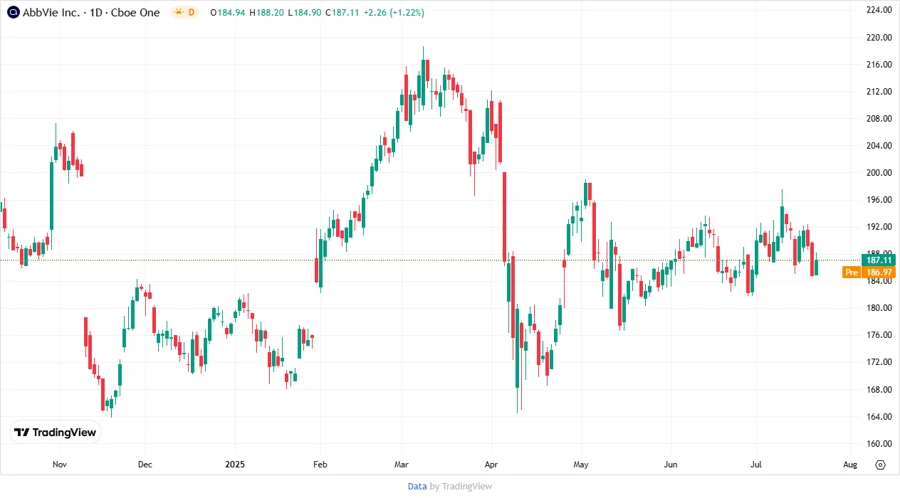
Price Development 📈
Dividend Scoring System ✅
| Criteria | Score (Out of 5) | Score Bar |
|---|---|---|
| Dividend yield | 4 | |
| Dividend Stability | 5 | |
| Dividend growth | 4 | |
| Payout ratio | 3 | |
| Financial stability | 2 | |
| Dividend continuity | 5 | |
| Cashflow Coverage | 4 | |
| Balance Sheet Quality | 2 |
Total Score: 29 out of 40
Rating 🗣️
Overall, AbbVie Inc. offers a consistent dividend payout and is a solid choice for income-focused investors. However, its high leverage and payout ratio present risks that need close monitoring. Investors should weigh these factors against their risk appetite and investment strategy.
Smart Data Insight
Master the Perfect Entry & Exit for this Stock
Don't leave your profits to chance. Historically, this stock follows specific seasonal patterns that institutional traders use to maximize returns.
- ✅ Identify the "Golden Buying Window"
- ✅ Avoid high-risk correction cycles
- ✅ Backtested data from the last 20+ years