June 22, 2025 a 12:46 pm


ABBV: Dividend Analysis - AbbVie Inc.
AbbVie Inc. offers a solid dividend profile with consistent payments and attractive yield. As a pharmaceutical giant, its commitment to returning capital back to shareholders is evident in its robust dividend history and moderate growth. However, high payout ratios need careful monitoring. This analysis examines key financial metrics to present a comprehensive overview of AbbVie's dividend sustainability and growth potential.
📊 Overview
AbbVie, operating within the pharmaceutical sector, maintains a notable dividend yield, currently standing at 3.61%. The company has a strong track record of over 13 years of unbroken dividend payments, signaling a commitment to rewarding shareholders. Despite this stability, it's crucial to note the last reported dividend cut or suspension was: None.
| Factor | Detail |
|---|---|
| Sector | Pharmaceuticals |
| Dividend Yield | 3.61% |
| Current Dividend per Share | 6.23 USD |
| Dividend History | 13 years |
| Last Cut or Suspension | None |
🗣️ Dividend History
Evaluating AbbVie's dividend history reveals a strong tradition of regular increases, underscoring the company's dedication to returning value to shareholders. Consistency in payments is a positive indicator of financial health and stability.
| Year | Dividend per Share (USD) |
|---|---|
| 2025 | 3.28 |
| 2024 | 6.20 |
| 2023 | 5.92 |
| 2022 | 5.64 |
| 2021 | 5.20 |
📈 Dividend Growth
The analysis of AbbVie's dividend growth over recent years indicates a moderate yet steady increment in payouts, reflecting a balanced approach to capital allocation. Understanding growth rates is crucial for assessing future payment stability.
| Time | Growth |
|---|---|
| 3 years | 6.04% |
| 5 years | 7.69% |
The average dividend growth is 7.69% over 5 years. This shows moderate but steady dividend growth.
🚦 Payout Ratio
AbbVie's payout ratio is a critical parameter for assessing dividend sustainability. The current EPS-based payout is significantly high at 262.66%, while the FCF-based payout is a more reasonable 71.56%.
| Key Figure | Ratio |
|---|---|
| EPS-based | 262.66% |
| FCF-based | 71.56% |
While the free cash flow coverage suggests sustainability, the elevated EPS payout signals caution and indicates that earnings may not fully support the dividend.
💼 Cashflow & Capital Efficiency
Understanding cash flow dynamics and capital efficiency helps predict a company's ability to maintain dividend payments. AbbVie's cash flow metrics need careful monitoring for ensuring ongoing financial health.
| Metric | 2024 | 2023 | 2022 |
|---|---|---|---|
| Free Cash Flow Yield | 5.67% | 8.05% | 8.47% |
| Earnings Yield | 1.36% | 1.77% | 4.14% |
| CAPEX to Operating Cash Flow | 5.18% | 3.40% | 2.79% |
| Stock-based Compensation to Revenue | 1.62% | 1.38% | 1.16% |
| Free Cash Flow / Operating Cash Flow Ratio | 94.82% | 96.60% | 97.21% |
The stability of AbbVie's cash flows and prudent capital efficiency are positive indicators of financial strength, supporting ongoing dividend distributions.
📋 Balance Sheet & Leverage Analysis
An evaluation of leverage metrics provides insight into a company's financial robustness. AbbVie's ratios suggest a high level of leverage, which carries inherent risks.
| Metric | 2024 | 2023 | 2022 |
|---|---|---|---|
| Debt-to-Equity | 2019.37% | 573.21% | 366.70% |
| Debt-to-Assets | 49.68% | 44.08% | 45.58% |
| Debt-to-Capital | 95.28% | 85.15% | 78.57% |
| Net Debt to EBITDA | 4.13 | 2.69 | 1.72 |
| Current Ratio | 0.76 | 0.87 | 0.96 |
| Quick Ratio | 0.55 | 0.76 | 0.84 |
| Financial Leverage | 40.65 | 13.00 | 8.04 |
While AbbVie maintains the ability to cover its interest obligations, the extensive leverage imposes substantial financial obligations, potentially impacting long-term stability.
📉 Fundamental Strength & Profitability
Assessing profitability ratios reveals the efficiency of a company in generating income based on equity, assets, and invested capital.
| Metric | 2024 | 2023 | 2022 |
|---|---|---|---|
| Return on Equity | 128.66% | 46.94% | 68.60% |
| Return on Assets | 3.17% | 3.61% | 8.53% |
| Return on Invested Capital | 18.58% | 9.56% | 14.04% |
| Margins (Net) | 7.59% | 8.95% | 20.39% |
| Margins (EBIT) | 11.58% | 15.85% | 27.06% |
| Margins (EBITDA) | 26.47% | 31.86% | 54.13% |
| Margins (Gross) | 69.99% | 62.42% | 70.00% |
| R&D to Revenue | 14.76% | 15.56% | 11.21% |
AbbVie's profitability ratios depict robust financial performance, yet the fluctuating returns warrant vigilance to ensure consistent operational success.
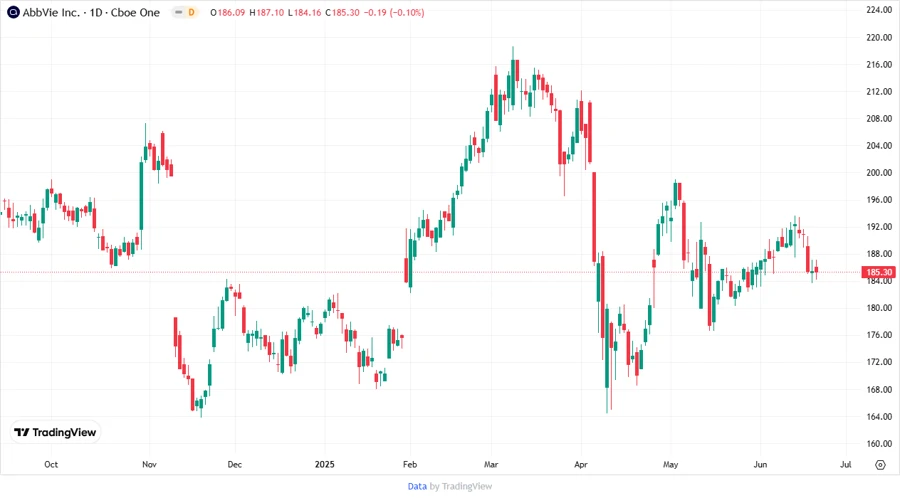
📈 Price Development
✅ Dividend Scoring System
| Category | Score | Indicator |
|---|---|---|
| Dividend yield | 4 | |
| Dividend Stability | 5 | |
| Dividend growth | 3 | |
| Payout ratio | 2 | |
| Financial stability | 3 | |
| Dividend continuity | 5 | |
| Cashflow Coverage | 4 | |
| Balance Sheet Quality | 2 |
Overall Score: 28/40
🛡️ Rating
AbbVie's dividend profile reflects a strong commitment to shareholder returns, with a solid history and moderate growth potential. Despite challenges in payout ratios, its financials support ongoing distributions. Cautious optimism is warranted as the company continues to navigate its leverage position.