
May 27, 2026 a 05:15 am
AAPL: Fibonacci Analysis - Apple Inc.
Apple Inc. has experienced a consistent upward trajectory in recent months, driven by solid demand for its range of innovative products and services. The company's diverse offerings, from smartphones to cloud services, position it well in the market. Investors remain optimistic as Apple continues to exhibit strong financial health and growth potential. As the tech giant reveals new advancements, its stock is anticipated to maintain its bullish momentum.
Fibonacci Analysis
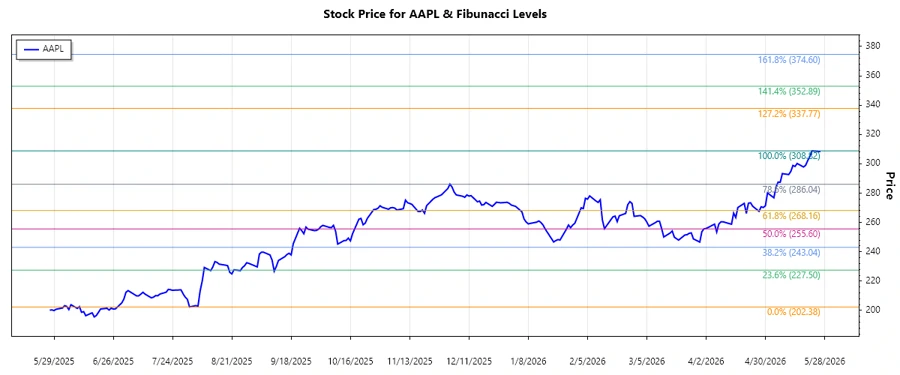
The recent trend in Apple Inc.'s stock price from early 2025 to mid-2026 demonstrates a strong upward movement. This upward trend is evident from the data spanning March 2026 through May 2026.
| Detail | Information |
|---|---|
| Trend Start Date | 2025-08-05 |
| Trend End Date | 2026-05-26 |
| High Price (Date) | $308.82 (2026-05-22) |
| Low Price (Date) | $202.38 (2025-08-01) |
Fibonacci Levels
| Fibonacci Level | Price Level |
|---|---|
| 0.236 | $230.80 |
| 0.382 | $246.62 |
| 0.5 | $255.60 |
| 0.618 | $264.58 |
| 0.786 | $278.38 |
The current stock price of AAPL is $308.33, which remains above the calculated Fibonacci retracement levels. No significant retracement is currently occurring.
In conclusion, Apple Inc. is likely to find strong support around the $255 to $265 range based on Fibonacci levels. These levels might act as crucial support zones, providing potential buying opportunities if the stock price retraces.
Conclusion
Apple Inc.'s upward price momentum highlights the company's robust market position and continued investor confidence. The absence of retracement suggests resilience, with potential support levels well defined by Fibonacci analysis. Analysts might view this as a bullish sign in the short term. However, given the general market conditions, potential risks include market saturation and the impact of broader economic changes. Nevertheless, Apple's innovation-led strategy and service diversification could continue to bear fruit, maintaining its appeal for growth-focused investors.
Smart Data Insight
Master the Perfect Entry & Exit for this Stock
Don't leave your profits to chance. Historically, this stock follows specific seasonal patterns that institutional traders use to maximize returns.
- ✅ Identify the "Golden Buying Window"
- ✅ Avoid high-risk correction cycles
- ✅ Backtested data from the last 20+ years