June 03, 2025 a 03:15 pm

AAPL: Fibonacci Analysis - Apple Inc.
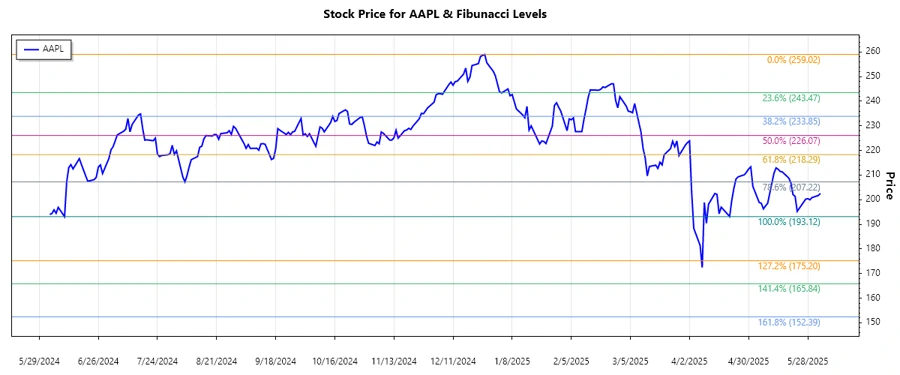
Apple Inc. continues to showcase its innovative prowess with an extensive product line and strong services ecosystem. Over recent months, the stock has witnessed a declining trend, reflecting a challenging market environment. Technical indicators suggest potential retracement levels, offering critical insights for traders and investors. This analysis delves into Fibonacci retracement levels, highlighting key price areas to watch.
Fibonacci Analysis
| Analysis Parameter | Details |
|---|---|
| Trend Start Date | 2024-12-26 |
| Trend End Date | 2025-06-03 |
| High Point (Price and Date) | $259.02 on 2024-12-26 |
| Low Point (Price and Date) | $193.12 on 2024-06-10 |
| Fibonacci Level | Price Level |
|---|---|
| 0.236 | $208.9624 |
| 0.382 | $220.9676 |
| 0.500 | $226.0700 |
| 0.618 | $231.1724 |
| 0.786 | $239.5108 |
The current price of $202.535 is not sitting within a key Fibonacci retracement zone. This suggests traders should anticipate possible support levels at lower retracement levels. Monitoring these levels can provide insights into potential price movements.
Conclusion
Apple Inc.'s stock trend reflects typical market volatility with potential retracement levels to consider for strategic entry and exit points. While the price has not reached major Fibonacci retracement levels, future moves could present critical opportunities for traders. The company’s robust ecosystem and product offerings remain strong fundamentals, but market factors can influence short-term performance. Monitoring technical indicators and broader market dynamics is essential for informed decision-making. Investors should balance potential rewards with inherent market risks, using technical analysis as a guide.
Smart Data Insight
Master the Perfect Entry & Exit for this Stock
Don't leave your profits to chance. Historically, this stock follows specific seasonal patterns that institutional traders use to maximize returns.
- ✅ Identify the "Golden Buying Window"
- ✅ Avoid high-risk correction cycles
- ✅ Backtested data from the last 20+ years