
June 16, 2026 a 03:31 am

AAPL: Dividend Analysis - Apple Inc.
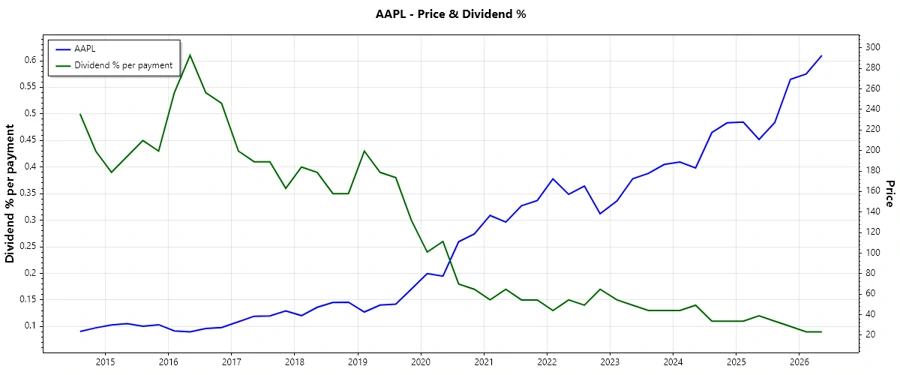
🗣️ Apple Inc. (AAPL) has consistently been a strong performer with its stock, largely due to its innovative product lines and strategic market positioning. Despite a modest dividend yield, AAPL exhibits a robust history of dividend payments, making it a potentially attractive option for income-focused investors. The company's financial resilience and strategic foresight underscore its potential for sustained long-term shareholder value.
Overview 📊
Apple's operations span the technology sector, where it has successfully maintained a dividend history for 24 years without any recent cuts or suspensions. The current dividend yield stands at approximately 0.36%, underpinned by a recent dividend distribution of $1.03 per share. This underlines AAPL's commitment to providing consistent shareholder returns while maintaining sufficient reinvestment into its business operations.
| Sector | Dividend Yield | Current Dividend Per Share | Dividend History | Last Cut or Suspension |
|---|---|---|---|---|
| Technology | 0.36% | $1.03 | 24 years | None |
Dividend History 📉
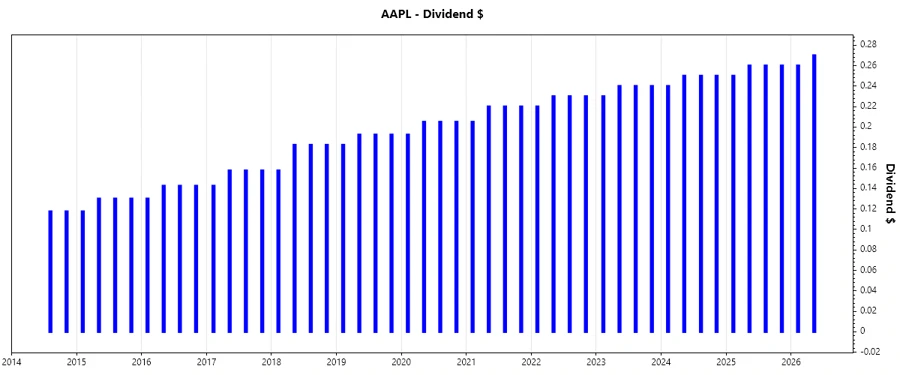
📅 The historical dividend payments showcase Apple’s stability and commitment to rewarding its shareholders. A consistent dividend history, as demonstrated by AAPL, often implies financial stability and a solid management strategy.
| Year | Dividend Per Share (USD) |
|---|---|
| 2026 | 0.53 |
| 2025 | 1.03 |
| 2024 | 0.99 |
| 2023 | 0.95 |
| 2022 | 0.91 |
Dividend Growth 📈
📊 Assessing dividend growth is crucial as it reflects the company’s ability to increase shareholder returns. AAPL's dividend growth rates of 4.22% over 3 years and 4.99% over 5 years indicate a steady yet moderate increase in dividends, suggesting a balanced approach between immediate shareholder returns and long-term business investment.
| Time | Growth |
|---|---|
| 3 years | 4.22% |
| 5 years | 4.99% |
The average dividend growth is 4.99% over 5 years. This shows moderate but steady dividend growth.
Payout Ratio 💼
💰 Examining the payout ratio offers insight into AAPL's earnings distribution strategy. An EPS-based payout ratio of 12.38% and an FCF-based payout ratio of 11.73% highlight the company's effective balance between maintaining attractive dividend payouts while conserving ample profits and free cash flow for potential reinvestment.
| Key figure | Ratio |
|---|---|
| EPS-based | 12.38% |
| Free cash flow-based | 11.73% |
Cashflow & Capital Efficiency
📈 Cash flow efficiency showcases Apple’s operational strength. A strong Free Cash Flow Yield and favorable ratios like a CAPEX to Operating Cash Flow ratio of 7.88%, highlight Apple's adept management in enhancing liquidity and funding operational expenses.
| 2023 | 2024 | 2025 | |
|---|---|---|---|
| Free Cash Flow Yield | 3.69% | 3.11% | 2.59% |
| Earnings Yield | 3.60% | 2.68% | 2.93% |
| CAPEX to Operating Cash Flow | 9.91% | 7.99% | 14.40% |
| Stock-based Compensation to Revenue | 2.83% | 2.99% | 3.09% |
| Free Cash Flow / Operating Cash Flow Ratio | 90.08% | 92.01% | 88.60% |
Balance Sheet & Leverage Analysis
💪 Understanding Apple's leverage is essential for evaluating its financial health. Metrics such as a Debt-to-Equity ratio, along with low Debt-to-Assets ratios, suggest strong financial leverage and prudent debt management.
| 2023 | 2024 | 2025 | |
|---|---|---|---|
| Debt-to-Equity | 199.42% | 209.06% | 152.41% |
| Debt-to-Assets | 35.15% | 32.62% | 31.28% |
| Debt-to-Capital | 66.60% | 67.64% | 60.38% |
| Net Debt to EBITDA | 0.73x | 0.66x | 0.53x |
| Current Ratio | 0.99 | 0.87 | 0.89 |
| Quick Ratio | 0.94 | 0.83 | 0.86 |
| Financial Leverage | 5.67 | 6.41 | 4.87 |
Fundamental Strength & Profitability
🎯 Apple’s fundamental profitability ratios, like the Return on Equity, underscore its efficiency in generating earnings. Along with this, healthy margins across various streams illustrate robust operational effectiveness.
| 2023 | 2024 | 2025 | |
|---|---|---|---|
| Return on Equity | 156.08% | 164.59% | 151.91% |
| Return on Assets | 27.51% | 25.68% | 31.18% |
| Margins: Net | 25.31% | 23.97% | 26.92% |
| EBIT | 30.70% | 31.58% | 31.89% |
| EBITDA | 33.71% | 34.51% | 34.70% |
| Gross | 44.13% | 46.21% | 46.91% |
| R&D to Revenue | 7.80% | 8.02% | 8.30% |
Price Development 📈
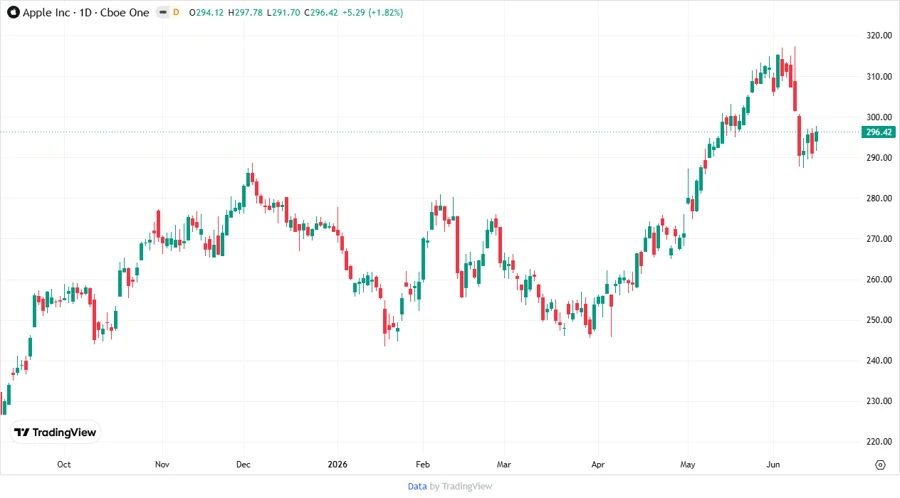
📉 Apple's stock price movement must be considered for an investment decision as it displays the market's perception and investor sentiment toward the company’s performance.
Dividend Scoring System 🌟
| Criteria | Score | Bar |
|---|---|---|
| Dividend yield | 3 | |
| Dividend Stability | 5 | |
| Dividend growth | 4 | |
| Payout ratio | 5 | |
| Financial stability | 5 | |
| Dividend continuity | 5 | |
| Cashflow Coverage | 4 | |
| Balance Sheet Quality | 4 |
Total Score: 35/40
Rating 🏆
🗣️ Apple Inc. represents a stable and rewarding opportunity for investors with its strong financial health, robust dividend history, and prudent payout strategy. While the dividend yield is modest, the company's growth potential and dividend reliability present a compelling case for long-term investment, especially suitable for risk-averse and income-focused investors.
Smart Data Insight
Master the Perfect Entry & Exit for this Stock
Don't leave your profits to chance. Historically, this stock follows specific seasonal patterns that institutional traders use to maximize returns.
- ✅ Identify the "Golden Buying Window"
- ✅ Avoid high-risk correction cycles
- ✅ Backtested data from the last 20+ years