SCHW: Fundamental Ratio Analysis - The Charles Schwab Corporation

SCHW: Evaluation of key financial ratios, analyst ratings, and price targets. A data-driven perspective on the valuation and market expectations.
March 18, 2026 a 07:43 am
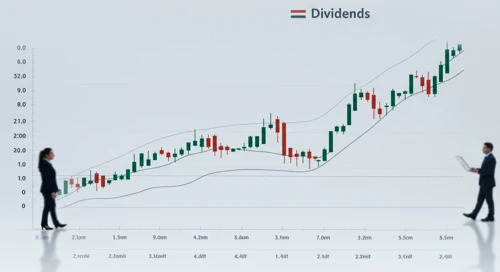
DE: Dividend Analysis - Deere and Company

DE: In-depth analysis of a company's dividend stability and key fundamental ratios to assess its financial strength and long-term investment potential.
March 18, 2026 a 07:31 am
MAA: Fibunacci Level Technical Analysis - Mid America Apartment Communities Inc
MAA: Fibonacci retracement levels to identify key potential support and resistance zones, based on recent price trends.
March 18, 2026 a 06:45 am
AES: Fibunacci Level Technical Analysis - The AES Corporation
AES: Fibonacci retracement levels to identify key potential support and resistance zones, based on recent price trends.
March 18, 2026 a 05:15 am
GBPSEK: Fibunacci Level Technical Analysis
GBPSEK: Fibonacci retracement levels to identify key potential support and resistance zones, based on recent price trends.
March 18, 2026 a 05:08 am
CADCHF: Trend with Support and Resistance Levels
CADCHF: Current price trend is evaluated alongside key support and resistance level. View of potential turning points and price momentum.
March 18, 2026 a 04:28 am
AMCR: Trend with Support and Resistance Levels - Amcor plc
AMCR: Current price trend is evaluated alongside key support and resistance level. View of potential turning points and price momentum.
March 18, 2026 a 04:03 am
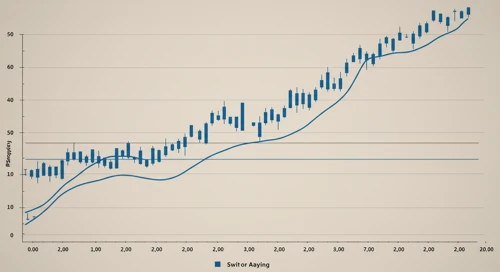
FOXA: Trend with Support and Resistance Levels - Fox Corporation
March 18, 2026 a 09:04 am

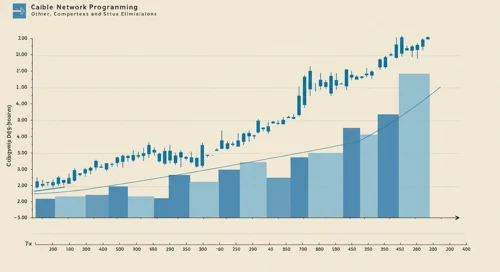
CL: Analysts Ratings - Colgate Palmolive Company
March 18, 2026 a 09:00 am
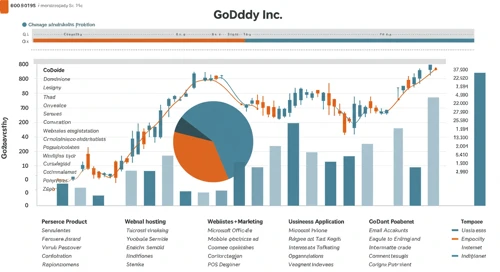
GDDY: Analysts Ratings - GoDaddy Inc
March 18, 2026 a 08:38 am
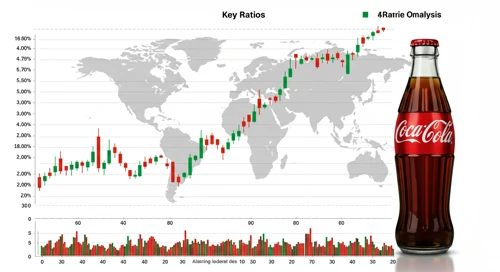
KO: Fundamental Ratio Analysis - The Coca Cola Company
March 18, 2026 a 08:00 am
NXPI: Dividend Analysis - NXP Semiconductors NV
NXPI: In-depth analysis of a company's dividend stability and key fundamental ratios to assess its financial strength and long-term investment potential.
March 18, 2026 a 03:31 am
JBHT: Trend with Support and Resistance Levels - JB Hunt Transport Services Inc
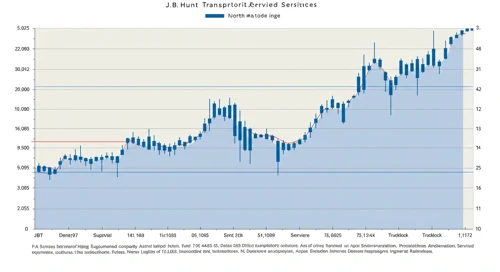
JBHT: Current price trend is evaluated alongside key support and resistance level. View of potential turning points and price momentum.
March 18, 2026 a 03:15 am
CHRW: Dividend Analysis - CH Robinson Worldwide Inc

CHRW: In-depth analysis of a company's dividend stability and key fundamental ratios to assess its financial strength and long-term investment potential.
March 18, 2026 a 02:46 am
Todays Important Key Figures 18 Mar

Today’s important economic data releases – a snapshot of key indicators influencing markets and shaping financial expectations.
March 17, 2026 a 11:00 pm
SO: Analysts Ratings - The Southern Company
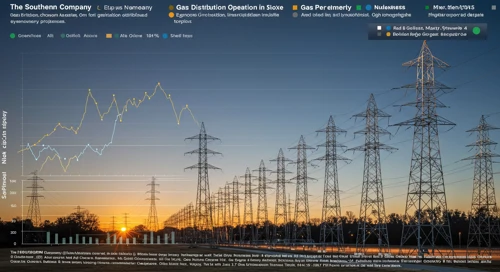
SO: Comprehensive breakdown of current and historical analyst ratings, offering insights into how expert sentiment has evolved over time.
March 17, 2026 a 09:00 pm
ORCL: Analysts Ratings - Oracle Corporation

ORCL: Comprehensive breakdown of current and historical analyst ratings, offering insights into how expert sentiment has evolved over time.
March 17, 2026 a 08:38 pm
SWKS: Fundamental Ratio Analysis - Skyworks Solutions Inc
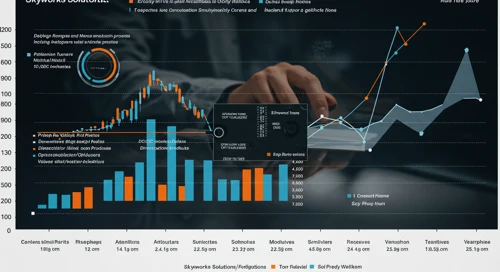
SWKS: Evaluation of key financial ratios, analyst ratings, and price targets. A data-driven perspective on the valuation and market expectations.
March 17, 2026 a 07:43 pm
Stock Market - Heatmap
Use mouse wheel to zoom in and out. Click a ticker to display detailed information in a new window. Hover mouse cursor over a ticker to see more data.
Stock's
VST: Dividend Analysis - Vistra Corp

VST: In-depth analysis of a company's dividend stability and key fundamental ratios to assess its financial strength and long-term investment potential.
March 17, 2026 a 03:31 pm
BAC: Fibunacci Level Technical Analysis - Bank of America Corporation
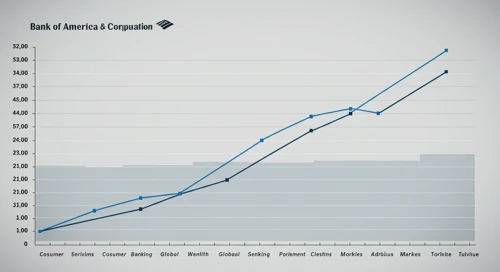
BAC: Fibonacci retracement levels to identify key potential support and resistance zones, based on recent price trends.
March 17, 2026 a 03:15 pm
MA: Trend with Support and Resistance Levels - Mastercard Incorporated
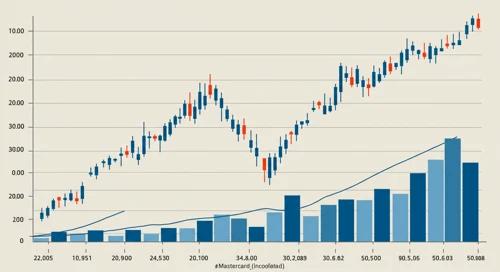
MA: Current price trend is evaluated alongside key support and resistance level. View of potential turning points and price momentum.
March 17, 2026 a 02:03 pm
VTRS: Trend with Support and Resistance Levels - Viatris Inc
VTRS: Current price trend is evaluated alongside key support and resistance level. View of potential turning points and price momentum.
March 17, 2026 a 01:15 pm
CSCO: Fundamental Ratio Analysis - Cisco Systems Inc

CSCO: Evaluation of key financial ratios, analyst ratings, and price targets. A data-driven perspective on the valuation and market expectations.
March 17, 2026 a 01:00 pm
AWK: Analysts Ratings - American Water Works Company Inc
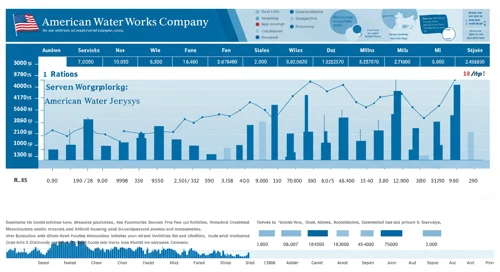
AWK: Comprehensive breakdown of current and historical analyst ratings, offering insights into how expert sentiment has evolved over time.
March 17, 2026 a 01:00 pm
BLK: Dividend Analysis - BlackRock Inc

BLK: In-depth analysis of a company's dividend stability and key fundamental ratios to assess its financial strength and long-term investment potential.
March 17, 2026 a 12:46 pm

AXP: Fundamental Ratio Analysis - American Express Company
March 17, 2026 a 06:00 pm

CTVA: Analysts Ratings - Corteva Inc
March 17, 2026 a 05:00 pm
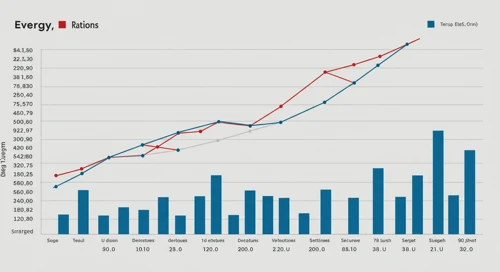
EVRG: Analysts Ratings - Evergy Inc
March 17, 2026 a 04:38 pm

AON: Fundamental Ratio Analysis - Aon plc
March 17, 2026 a 03:43 pm
SNA: Analysts Ratings - Snap on Incorporated
SNA: Comprehensive breakdown of current and historical analyst ratings, offering insights into how expert sentiment has evolved over time.
March 17, 2026 a 12:38 pm
CPB: Fibunacci Level Technical Analysis - Campbell Soup Company
CPB: Fibonacci retracement levels to identify key potential support and resistance zones, based on recent price trends.
March 17, 2026 a 11:44 am
UPS: Fundamental Ratio Analysis - United Parcel Service Inc
UPS: Evaluation of key financial ratios, analyst ratings, and price targets. A data-driven perspective on the valuation and market expectations.
March 17, 2026 a 11:43 am
LLY: Dividend Analysis - Eli Lilly and Company

LLY: In-depth analysis of a company's dividend stability and key fundamental ratios to assess its financial strength and long-term investment potential.
March 17, 2026 a 11:31 am
FRT: Fibunacci Level Technical Analysis - Federal Realty Investment Trust
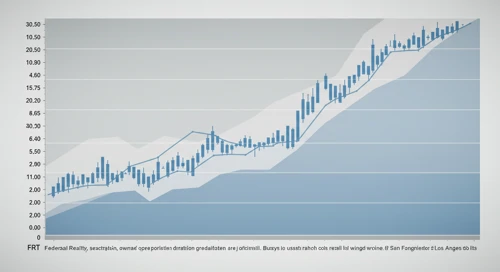
FRT: Fibonacci retracement levels to identify key potential support and resistance zones, based on recent price trends.
March 17, 2026 a 10:15 am
REGN: Trend with Support and Resistance Levels - Regeneron Pharmaceuticals Inc
REGN: Current price trend is evaluated alongside key support and resistance level. View of potential turning points and price momentum.
March 17, 2026 a 09:03 am
CME: Analysts Ratings - CME Group Inc
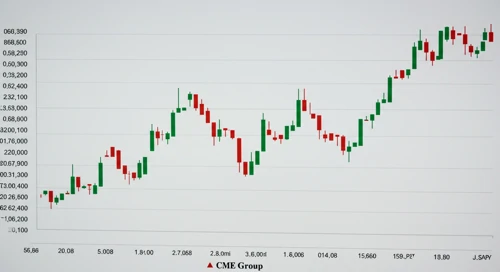
CME: Comprehensive breakdown of current and historical analyst ratings, offering insights into how expert sentiment has evolved over time.
March 17, 2026 a 09:00 am
Economic Calendar
Currencies
EURGBP: Fibunacci Level Technical Analysis

EURGBP: Fibonacci retracement levels to identify key potential support and resistance zones, based on recent price trends.
March 15, 2026 a 05:08 am
EURJPY: Trend with Support and Resistance Levels
EURJPY: Current price trend is evaluated alongside key support and resistance level. View of potential turning points and price momentum.
March 15, 2026 a 04:28 am
AUDCAD: Fibunacci Level Technical Analysis
AUDCAD: Fibonacci retracement levels to identify key potential support and resistance zones, based on recent price trends.
March 14, 2026 a 05:08 am
AUDUSD: Trend with Support and Resistance Levels
AUDUSD: Current price trend is evaluated alongside key support and resistance level. View of potential turning points and price momentum.
March 14, 2026 a 04:28 am
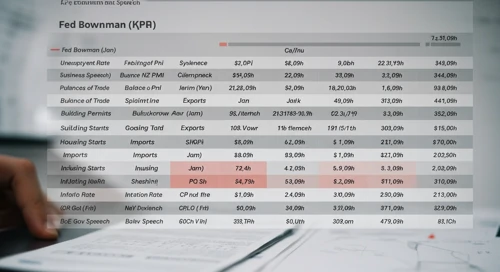
Todays Important Key Figures 14 Mar
Today’s important economic data releases – a snapshot of key indicators influencing markets and shaping financial expectations.
March 13, 2026 a 11:00 pm
Todays Important Key Figures 13 Mar

Today’s important economic data releases – a snapshot of key indicators influencing markets and shaping financial expectations.
March 13, 2026 a 07:00 pm
GBPCHF: Fibunacci Level Technical Analysis
GBPCHF: Fibonacci retracement levels to identify key potential support and resistance zones, based on recent price trends.
March 13, 2026 a 05:08 am
Todays Important Key Figures 17 Mar
March 17, 2026 a 07:00 pm
EURUSD: Fibunacci Level Technical Analysis
March 17, 2026 a 05:08 am
Important Key Figures of the last Days
March 17, 2026 a 02:31 am
Todays Important Key Figures 16 Mar
March 16, 2026 a 07:00 pm
AUDJPY: Trend with Support and Resistance Levels
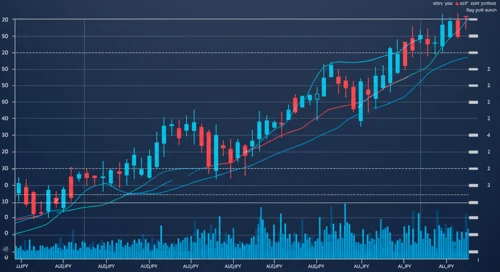
AUDJPY: Current price trend is evaluated alongside key support and resistance level. View of potential turning points and price momentum.
March 13, 2026 a 04:28 am
Todays Important Key Figures 12 Mar
Today’s important economic data releases – a snapshot of key indicators influencing markets and shaping financial expectations.
March 12, 2026 a 07:00 pm
AUDNZD: Fibunacci Level Technical Analysis
AUDNZD: Fibonacci retracement levels to identify key potential support and resistance zones, based on recent price trends.
March 12, 2026 a 05:08 am
CHFJPY: Trend with Support and Resistance Levels
CHFJPY: Current price trend is evaluated alongside key support and resistance level. View of potential turning points and price momentum.
March 12, 2026 a 04:28 am
Important Key Figures of the last Days
Overview of key economic indicators released over the past days, highlighting their potential impact on markets and investor sentiment.
March 12, 2026 a 02:31 am
Todays Important Key Figures 11 Mar

Today’s important economic data releases – a snapshot of key indicators influencing markets and shaping financial expectations.
March 11, 2026 a 07:00 pm
EURNZD: Fibunacci Level Technical Analysis
EURNZD: Fibonacci retracement levels to identify key potential support and resistance zones, based on recent price trends.
March 11, 2026 a 05:08 am
Currencies