SBUX: Analysts Ratings - Starbucks Corporation

SBUX: Comprehensive breakdown of current and historical analyst ratings, offering insights into how expert sentiment has evolved over time.
December 13, 2025 a 05:00 pm
TSCO: Fibunacci Level Technical Analysis - Tractor Supply Company

TSCO: Fibonacci retracement levels to identify key potential support and resistance zones, based on recent price trends.
December 13, 2025 a 04:44 pm
TYL: Analysts Ratings - Tyler Technologies Inc

TYL: Comprehensive breakdown of current and historical analyst ratings, offering insights into how expert sentiment has evolved over time.
December 13, 2025 a 04:38 pm
NWS: Fundamental Ratio Analysis - News Corporation

NWS: Evaluation of key financial ratios, analyst ratings, and price targets. A data-driven perspective on the valuation and market expectations.
December 13, 2025 a 03:43 pm
WRB: Dividend Analysis - W R Berkley Corporation

WRB: In-depth analysis of a company's dividend stability and key fundamental ratios to assess its financial strength and long-term investment potential.
December 13, 2025 a 03:31 pm
Consumer Staples Comparison. 13 Dec

Comparison of Consumer Staples. Where is strength and weakness? What has developed well and badly?
December 13, 2025 a 03:31 pm
APD: Fibunacci Level Technical Analysis - Air Products and Chemicals Inc

APD: Fibonacci retracement levels to identify key potential support and resistance zones, based on recent price trends.
December 13, 2025 a 03:15 pm
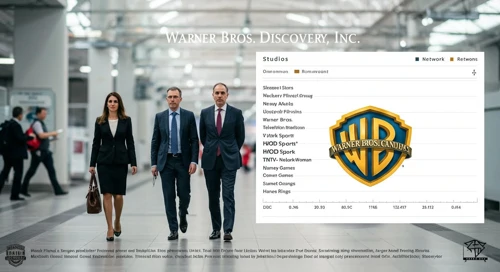
WBD: Analysts Ratings - Warner Bros Discovery Inc
December 13, 2025 a 09:00 pm
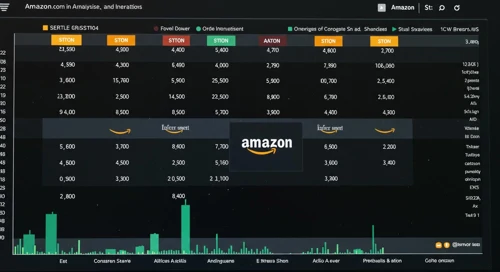
AMZN: Analysts Ratings - Amazoncom Inc
December 13, 2025 a 08:38 pm

FDX: Fundamental Ratio Analysis - FedEx Corporation
December 13, 2025 a 07:43 pm
HPQ: Fundamental Ratio Analysis - HP Inc
December 13, 2025 a 06:01 pm
NUE: Trend with Support and Resistance Levels - Nucor Corporation
NUE: Current price trend is evaluated alongside key support and resistance level. View of potential turning points and price momentum.
December 13, 2025 a 02:03 pm
GEV: Trend with Support and Resistance Levels - GE Vernova Inc

GEV: Current price trend is evaluated alongside key support and resistance level. View of potential turning points and price momentum.
December 13, 2025 a 01:15 pm
COF: Analysts Ratings - Capital One Financial Corporation

COF: Comprehensive breakdown of current and historical analyst ratings, offering insights into how expert sentiment has evolved over time.
December 13, 2025 a 01:00 pm
SBAC: Analysts Ratings - SBA Communications Corporation
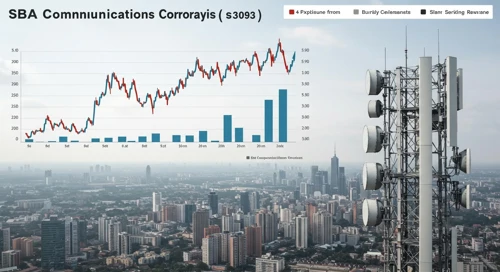
SBAC: Comprehensive breakdown of current and historical analyst ratings, offering insights into how expert sentiment has evolved over time.
December 13, 2025 a 12:38 pm
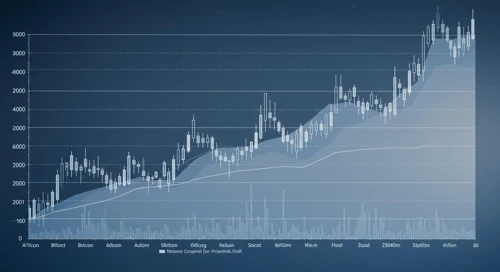
Crypto Comparison. 13 Dec

Comparison of Crypto. Where is strength and weakness? What has developed well and badly?
December 13, 2025 a 12:31 pm
HII: Fibunacci Level Technical Analysis - Huntington Ingalls Industries Inc
HII: Fibonacci retracement levels to identify key potential support and resistance zones, based on recent price trends.
December 13, 2025 a 11:44 am
NOC: Fundamental Ratio Analysis - Northrop Grumman Corporation

NOC: Evaluation of key financial ratios, analyst ratings, and price targets. A data-driven perspective on the valuation and market expectations.
December 13, 2025 a 11:43 am
Stock Market - Heatmap
Use mouse wheel to zoom in and out. Click a ticker to display detailed information in a new window. Hover mouse cursor over a ticker to see more data.
Stock's
MNST: Analysts Ratings - Monster Beverage Corporation
MNST: Comprehensive breakdown of current and historical analyst ratings, offering insights into how expert sentiment has evolved over time.
December 13, 2025 a 08:38 am
FICO: Trend with Support and Resistance Levels - Fair Isaac Corporation
FICO: Current price trend is evaluated alongside key support and resistance level. View of potential turning points and price momentum.
December 13, 2025 a 08:15 am
WDC: Fundamental Ratio Analysis - Western Digital Corporation

WDC: Evaluation of key financial ratios, analyst ratings, and price targets. A data-driven perspective on the valuation and market expectations.
December 13, 2025 a 08:00 am
MA: Fundamental Ratio Analysis - Mastercard Incorporated

MA: Evaluation of key financial ratios, analyst ratings, and price targets. A data-driven perspective on the valuation and market expectations.
December 13, 2025 a 07:43 am
STZ: Dividend Analysis - Constellation Brands Inc
STZ: In-depth analysis of a company's dividend stability and key fundamental ratios to assess its financial strength and long-term investment potential.
December 13, 2025 a 07:31 am
EBAY: Fibunacci Level Technical Analysis - eBay Inc
EBAY: Fibonacci retracement levels to identify key potential support and resistance zones, based on recent price trends.
December 13, 2025 a 06:44 am
MAA: Fibunacci Level Technical Analysis - Mid America Apartment Communities Inc
MAA: Fibonacci retracement levels to identify key potential support and resistance zones, based on recent price trends.
December 13, 2025 a 05:15 am

SBAC: Dividend Analysis - SBA Communications Corporation
December 13, 2025 a 11:31 am
RVTY: Fibunacci Level Technical Analysis - Revvity Inc
December 13, 2025 a 10:15 am
WST: Trend with Support and Resistance Levels - West Pharmaceutical Services Inc
December 13, 2025 a 09:03 am

J: Analysts Ratings - Jacobs Solutions Inc
December 13, 2025 a 09:00 am
ROK: Trend with Support and Resistance Levels - Rockwell Automation Inc
ROK: Current price trend is evaluated alongside key support and resistance level. View of potential turning points and price momentum.
December 13, 2025 a 04:03 am
HAS: Dividend Analysis - Hasbro Inc
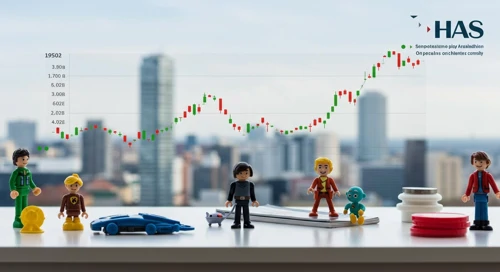
HAS: In-depth analysis of a company's dividend stability and key fundamental ratios to assess its financial strength and long-term investment potential.
December 13, 2025 a 03:31 am
BEN: Trend with Support and Resistance Levels - Franklin Resources Inc

BEN: Current price trend is evaluated alongside key support and resistance level. View of potential turning points and price momentum.
December 13, 2025 a 03:15 am
GPC: Dividend Analysis - Genuine Parts Company

GPC: In-depth analysis of a company's dividend stability and key fundamental ratios to assess its financial strength and long-term investment potential.
December 13, 2025 a 02:46 am
IVZ: Analysts Ratings - Invesco Ltd
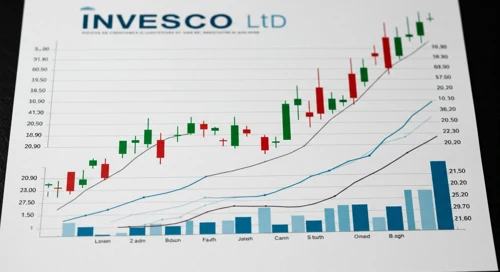
IVZ: Comprehensive breakdown of current and historical analyst ratings, offering insights into how expert sentiment has evolved over time.
December 12, 2025 a 09:00 pm
IFF: Analysts Ratings - International Flavors and Fragrances Inc

IFF: Comprehensive breakdown of current and historical analyst ratings, offering insights into how expert sentiment has evolved over time.
December 12, 2025 a 08:38 pm
ZBH: Fundamental Ratio Analysis - Zimmer Biomet Holdings Inc
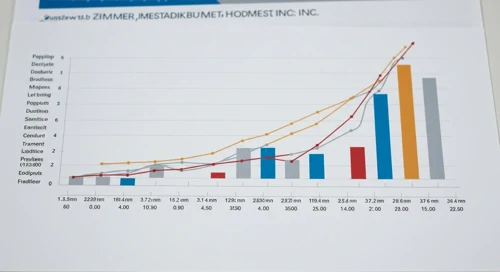
ZBH: Evaluation of key financial ratios, analyst ratings, and price targets. A data-driven perspective on the valuation and market expectations.
December 12, 2025 a 07:43 pm
Economic Calendar
Currencies
AUDCAD: Fibunacci Level Technical Analysis
AUDCAD: Fibonacci retracement levels to identify key potential support and resistance zones, based on recent price trends.
December 12, 2025 a 05:08 am
GBPUSD: Trend with Support and Resistance Levels

GBPUSD: Current price trend is evaluated alongside key support and resistance level. View of potential turning points and price momentum.
December 12, 2025 a 04:28 am
Todays Important Key Figures 11 Dec
Today’s important economic data releases – a snapshot of key indicators influencing markets and shaping financial expectations.
December 11, 2025 a 07:00 pm
AUDJPY: Fibunacci Level Technical Analysis
AUDJPY: Fibonacci retracement levels to identify key potential support and resistance zones, based on recent price trends.
December 11, 2025 a 05:08 am
GBPCAD: Trend with Support and Resistance Levels

GBPCAD: Current price trend is evaluated alongside key support and resistance level. View of potential turning points and price momentum.
December 11, 2025 a 04:28 am
Important Key Figures of the last Days
Overview of key economic indicators released over the past days, highlighting their potential impact on markets and investor sentiment.
December 11, 2025 a 02:31 am
Todays Important Key Figures 10 Dec

Today’s important economic data releases – a snapshot of key indicators influencing markets and shaping financial expectations.
December 10, 2025 a 07:00 pm

GBPSEK: Fibunacci Level Technical Analysis
December 13, 2025 a 05:08 am
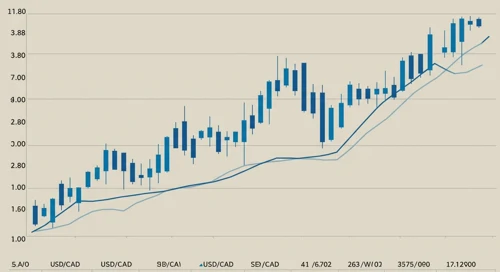
USDCAD: Trend with Support and Resistance Levels
December 13, 2025 a 04:28 am
Todays Important Key Figures 13 Dec
December 12, 2025 a 11:00 pm

Todays Important Key Figures 12 Dec
December 12, 2025 a 07:00 pm
EURAUD: Fibunacci Level Technical Analysis
EURAUD: Fibonacci retracement levels to identify key potential support and resistance zones, based on recent price trends.
December 10, 2025 a 05:08 am
GBPAUD: Trend with Support and Resistance Levels

GBPAUD: Current price trend is evaluated alongside key support and resistance level. View of potential turning points and price momentum.
December 10, 2025 a 04:28 am
Todays Important Key Figures 09 Dec
Today’s important economic data releases – a snapshot of key indicators influencing markets and shaping financial expectations.
December 09, 2025 a 07:00 pm
GBPNZD: Fibunacci Level Technical Analysis

GBPNZD: Fibonacci retracement levels to identify key potential support and resistance zones, based on recent price trends.
December 09, 2025 a 05:08 am
GBPJPY: Trend with Support and Resistance Levels
GBPJPY: Current price trend is evaluated alongside key support and resistance level. View of potential turning points and price momentum.
December 09, 2025 a 04:28 am
Important Key Figures of the last Days

Overview of key economic indicators released over the past days, highlighting their potential impact on markets and investor sentiment.
December 09, 2025 a 02:31 am
Todays Important Key Figures 08 Dec
Today’s important economic data releases – a snapshot of key indicators influencing markets and shaping financial expectations.
December 08, 2025 a 07:00 pm
Currencies