ERIE: Analysts Ratings - Erie Indemnity Company
ERIE: Comprehensive breakdown of current and historical analyst ratings, offering insights into how expert sentiment has evolved over time.
March 13, 2026 a 04:38 pm
LRCX: Fundamental Ratio Analysis - Lam Research Corporation
LRCX: Evaluation of key financial ratios, analyst ratings, and price targets. A data-driven perspective on the valuation and market expectations.
March 13, 2026 a 03:43 pm
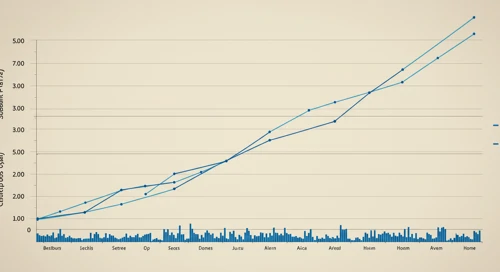
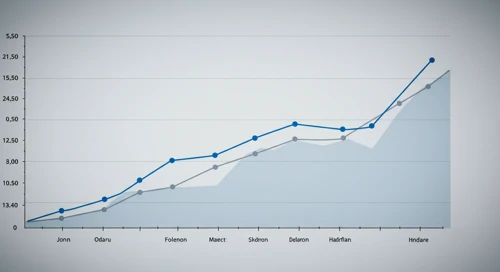
Europe Comparison. 13 Mar

Comparison of Europe. Where is strength and weakness? What has developed well and badly?
March 13, 2026 a 03:32 pm
WTW: Dividend Analysis - Willis Towers Watson Public Limited Company
WTW: In-depth analysis of a company's dividend stability and key fundamental ratios to assess its financial strength and long-term investment potential.
March 13, 2026 a 03:31 pm
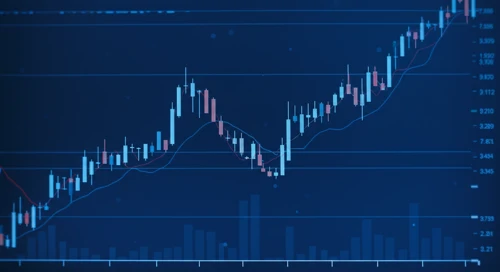
SMCI: Fibunacci Level Technical Analysis - Super Micro Computer Inc
SMCI: Fibonacci retracement levels to identify key potential support and resistance zones, based on recent price trends.
March 13, 2026 a 03:15 pm
BBY: Trend with Support and Resistance Levels - Best Buy Co Inc
BBY: Current price trend is evaluated alongside key support and resistance level. View of potential turning points and price momentum.
March 13, 2026 a 02:03 pm
GDDY: Analysts Ratings - GoDaddy Inc
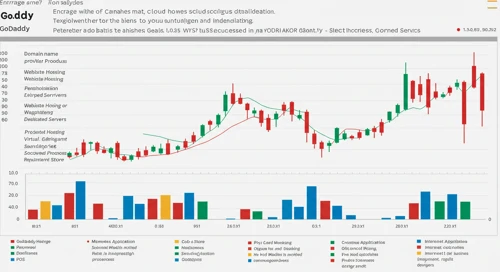
GDDY: Comprehensive breakdown of current and historical analyst ratings, offering insights into how expert sentiment has evolved over time.
March 13, 2026 a 01:00 pm

Todays Important Key Figures 13 Mar
March 13, 2026 a 07:00 pm
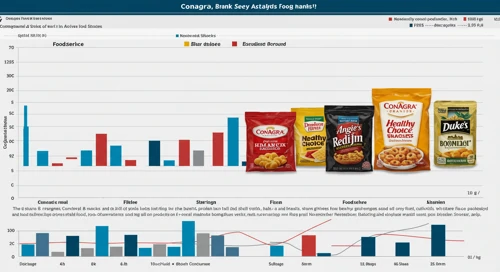
CAG: Fundamental Ratio Analysis - Conagra Brands Inc
March 13, 2026 a 06:00 pm

TFC: Analysts Ratings - Truist Financial Corporation
March 13, 2026 a 05:00 pm

FE: Fibunacci Level Technical Analysis - FirstEnergy Corp
March 13, 2026 a 04:44 pm
ETR: Fundamental Ratio Analysis - Entergy Corporation
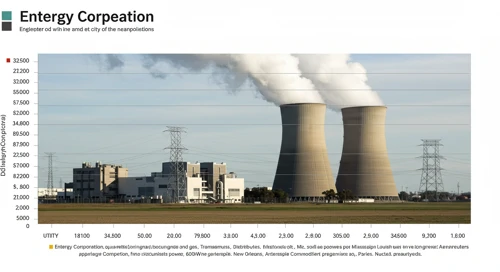
ETR: Evaluation of key financial ratios, analyst ratings, and price targets. A data-driven perspective on the valuation and market expectations.
March 13, 2026 a 01:00 pm
BBY: Analysts Ratings - Best Buy Co Inc
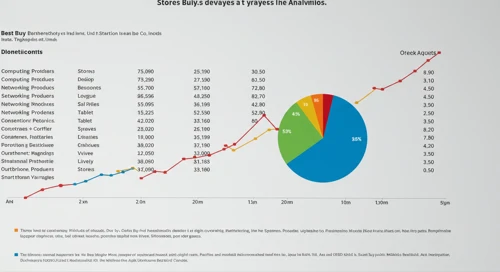
BBY: Comprehensive breakdown of current and historical analyst ratings, offering insights into how expert sentiment has evolved over time.
March 13, 2026 a 12:38 pm
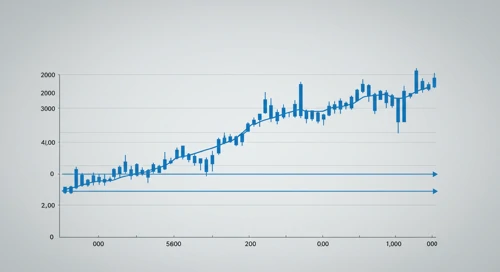
Major Indices Comparison. 13 Mar
Comparison of Major Indices. Where is strength and weakness? What has developed well and badly?
March 13, 2026 a 12:32 pm
CLX: Fibunacci Level Technical Analysis - The Clorox Company
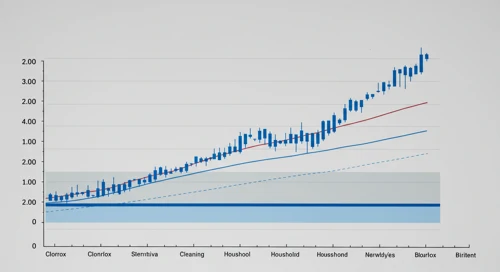
CLX: Fibonacci retracement levels to identify key potential support and resistance zones, based on recent price trends.
March 13, 2026 a 11:44 am
CARR: Fundamental Ratio Analysis - Carrier Global Corporation
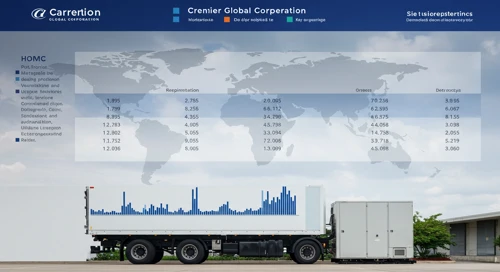
CARR: Evaluation of key financial ratios, analyst ratings, and price targets. A data-driven perspective on the valuation and market expectations.
March 13, 2026 a 11:43 am
MMM: Dividend Analysis - 3M Company
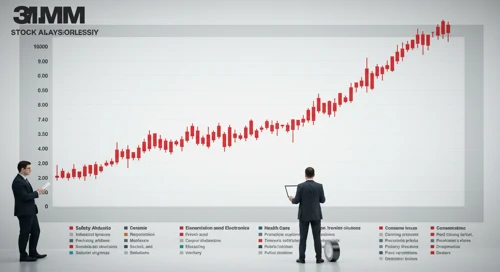
MMM: In-depth analysis of a company's dividend stability and key fundamental ratios to assess its financial strength and long-term investment potential.
March 13, 2026 a 11:31 am
PODD: Fibunacci Level Technical Analysis - Insulet Corporation
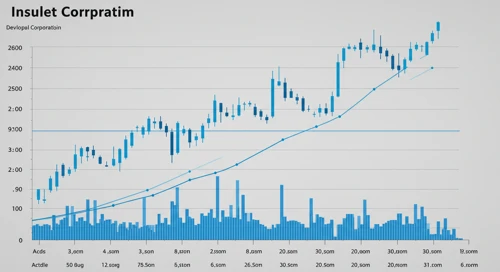
PODD: Fibonacci retracement levels to identify key potential support and resistance zones, based on recent price trends.
March 13, 2026 a 10:15 am
Stock Market - Heatmap
Use mouse wheel to zoom in and out. Click a ticker to display detailed information in a new window. Hover mouse cursor over a ticker to see more data.
Stock's
O: Dividend Analysis - Realty Income Corporation

O: In-depth analysis of a company's dividend stability and key fundamental ratios to assess its financial strength and long-term investment potential.
March 13, 2026 a 07:46 am
AKAM: Fundamental Ratio Analysis - Akamai Technologies Inc

AKAM: Evaluation of key financial ratios, analyst ratings, and price targets. A data-driven perspective on the valuation and market expectations.
March 13, 2026 a 07:43 am
AIG: Fibunacci Level Technical Analysis - American International Group Inc
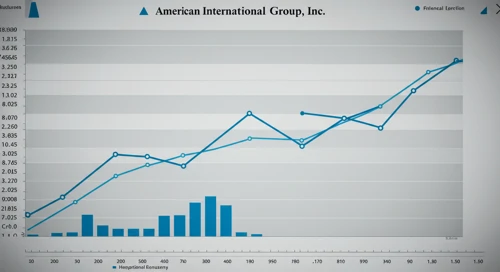
AIG: Fibonacci retracement levels to identify key potential support and resistance zones, based on recent price trends.
March 13, 2026 a 06:44 am
VZ: Fibunacci Level Technical Analysis - Verizon Communications Inc
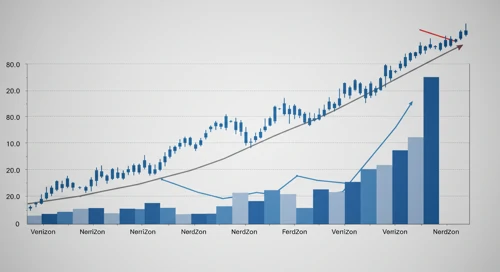
VZ: Fibonacci retracement levels to identify key potential support and resistance zones, based on recent price trends.
March 13, 2026 a 05:15 am
BMY: Trend with Support and Resistance Levels - Bristol Myers Squibb Company
BMY: Current price trend is evaluated alongside key support and resistance level. View of potential turning points and price momentum.
March 13, 2026 a 04:03 am
ALB: Dividend Analysis - Albemarle Corporation
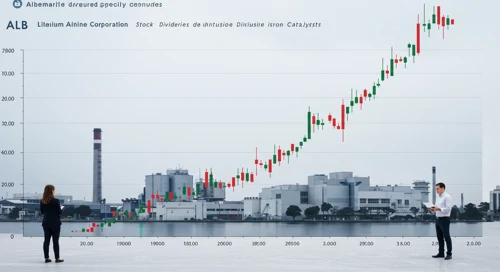
ALB: In-depth analysis of a company's dividend stability and key fundamental ratios to assess its financial strength and long-term investment potential.
March 13, 2026 a 03:31 am
IVZ: Trend with Support and Resistance Levels - Invesco Ltd
IVZ: Current price trend is evaluated alongside key support and resistance level. View of potential turning points and price momentum.
March 13, 2026 a 03:15 am
EPAM: Trend with Support and Resistance Levels - EPAM Systems Inc
March 13, 2026 a 09:03 am
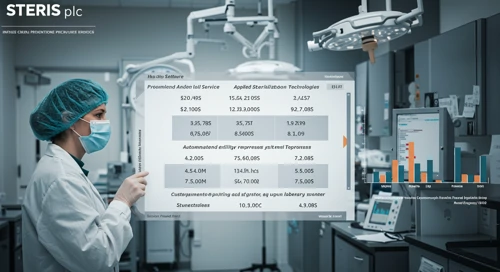
STE: Analysts Ratings - STERIS plc
March 13, 2026 a 09:00 am
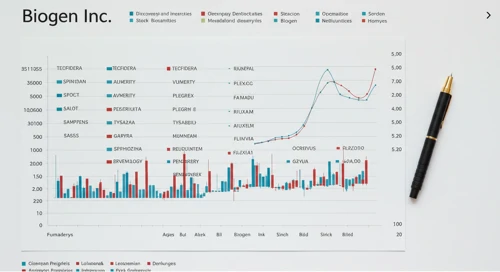
BIIB: Analysts Ratings - Biogen Inc
March 13, 2026 a 08:38 am
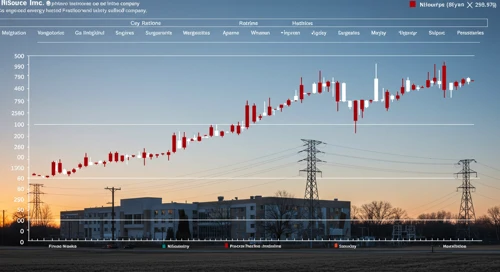
NI: Fundamental Ratio Analysis - NiSource Inc
March 13, 2026 a 08:00 am
BKR: Dividend Analysis - Baker Hughes Company

BKR: In-depth analysis of a company's dividend stability and key fundamental ratios to assess its financial strength and long-term investment potential.
March 13, 2026 a 02:46 am
AAPL: Analysts Ratings - Apple Inc
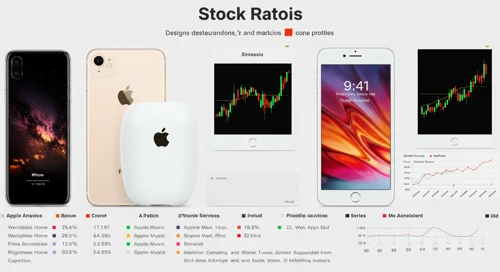
AAPL: Comprehensive breakdown of current and historical analyst ratings, offering insights into how expert sentiment has evolved over time.
March 12, 2026 a 09:00 pm
BALL: Analysts Ratings - Ball Corporation
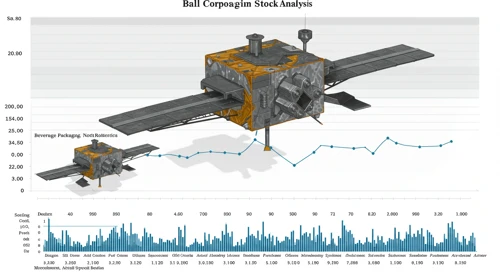
BALL: Comprehensive breakdown of current and historical analyst ratings, offering insights into how expert sentiment has evolved over time.
March 12, 2026 a 08:38 pm
ABBV: Fundamental Ratio Analysis - AbbVie Inc
ABBV: Evaluation of key financial ratios, analyst ratings, and price targets. A data-driven perspective on the valuation and market expectations.
March 12, 2026 a 07:43 pm
ROL: Fundamental Ratio Analysis - Rollins Inc
ROL: Evaluation of key financial ratios, analyst ratings, and price targets. A data-driven perspective on the valuation and market expectations.
March 12, 2026 a 06:00 pm
ROK: Analysts Ratings - Rockwell Automation Inc
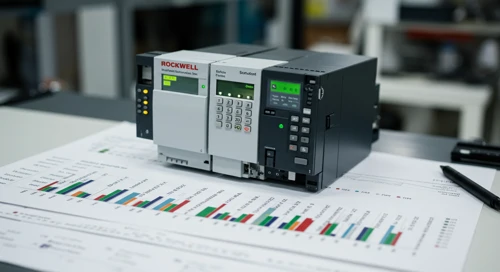
ROK: Comprehensive breakdown of current and historical analyst ratings, offering insights into how expert sentiment has evolved over time.
March 12, 2026 a 05:00 pm
BEN: Fibunacci Level Technical Analysis - Franklin Resources Inc
BEN: Fibonacci retracement levels to identify key potential support and resistance zones, based on recent price trends.
March 12, 2026 a 04:44 pm
Economic Calendar
Currencies
CHFJPY: Trend with Support and Resistance Levels
CHFJPY: Current price trend is evaluated alongside key support and resistance level. View of potential turning points and price momentum.
March 12, 2026 a 04:28 am
Important Key Figures of the last Days
Overview of key economic indicators released over the past days, highlighting their potential impact on markets and investor sentiment.
March 12, 2026 a 02:31 am
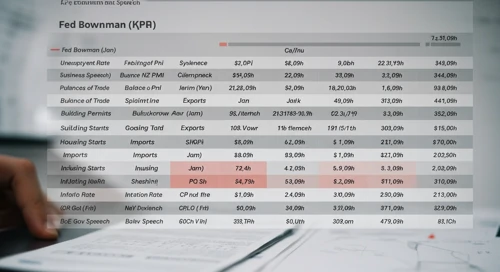
Todays Important Key Figures 11 Mar

Today’s important economic data releases – a snapshot of key indicators influencing markets and shaping financial expectations.
March 11, 2026 a 07:00 pm
EURNZD: Fibunacci Level Technical Analysis
EURNZD: Fibonacci retracement levels to identify key potential support and resistance zones, based on recent price trends.
March 11, 2026 a 05:08 am
Todays Important Key Figures 10 Mar
Today’s important economic data releases – a snapshot of key indicators influencing markets and shaping financial expectations.
March 10, 2026 a 07:02 pm
CADJPY: Fibunacci Level Technical Analysis
CADJPY: Fibonacci retracement levels to identify key potential support and resistance zones, based on recent price trends.
March 10, 2026 a 05:08 am
EURCHF: Trend with Support and Resistance Levels
EURCHF: Current price trend is evaluated alongside key support and resistance level. View of potential turning points and price momentum.
March 10, 2026 a 04:28 am
GBPCHF: Fibunacci Level Technical Analysis
March 13, 2026 a 05:08 am
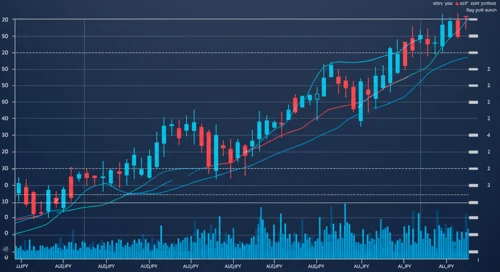
AUDJPY: Trend with Support and Resistance Levels
March 13, 2026 a 04:28 am
Todays Important Key Figures 12 Mar
March 12, 2026 a 07:00 pm
AUDNZD: Fibunacci Level Technical Analysis
March 12, 2026 a 05:08 am
Important Key Figures of the last Days

Overview of key economic indicators released over the past days, highlighting their potential impact on markets and investor sentiment.
March 10, 2026 a 02:31 am
Todays Important Key Figures 09 Mar
Today’s important economic data releases – a snapshot of key indicators influencing markets and shaping financial expectations.
March 09, 2026 a 07:00 pm
NZDJPY: Fibunacci Level Technical Analysis
NZDJPY: Fibonacci retracement levels to identify key potential support and resistance zones, based on recent price trends.
March 09, 2026 a 05:08 am
USDCHF: Trend with Support and Resistance Levels
USDCHF: Current price trend is evaluated alongside key support and resistance level. View of potential turning points and price momentum.
March 09, 2026 a 04:28 am
GBPCAD: Fibunacci Level Technical Analysis
GBPCAD: Fibonacci retracement levels to identify key potential support and resistance zones, based on recent price trends.
March 08, 2026 a 05:08 am
GBPAUD: Fibunacci Level Technical Analysis
GBPAUD: Fibonacci retracement levels to identify key potential support and resistance zones, based on recent price trends.
March 07, 2026 a 05:08 am
NZDCHF: Trend with Support and Resistance Levels
NZDCHF: Current price trend is evaluated alongside key support and resistance level. View of potential turning points and price momentum.
March 07, 2026 a 04:28 am
Currencies