Stock market returns and duration of crises

by SMO Team

Stock Market: Average returns and duration of crises
Those who know the past understand the future better.
In this article we show the long-term development of the stock markets over the last 50 years.
- How the stock markets have performed in the past?
- What is the average performance?
- How long did negative price developments last during crises?
- How big were the price declines (drawdowns)?
You can calculate the potential of your investment with our free investment calculator.
We use data from MSCI for this purpose. All calculations exclude dividends. The average returns of indices will therefore be somewhat lower than would result from evaluations with dividends. All rates are calculated in USD.
The following table shows the developments of the different stock markets. In the following chapters we look at each index.
Stock market historical development (overview):
| Annual Return (without dividends) | Worst Drawdown | Count Drawdowns longer 2 years | |
| MSCI World | 5.89% | -55.37% | 4 |
| MSCI World ex. US | 5.89% | -58.16% | 4 |
| MSCI North America | 6.65% | -52.65% | 5 |
| MSCI USA | 6.57% | -52.22% | 5 |
| MSCI Europe | 5.48% | -60.90% | 5 |
| MSCI Germany | 6.76% | -65.52% | 4 |
| MSCI Swiss | 8.07% | -49.01% | 5 |
| MSCI Pacific | 6.72% | -47.49% | 5 |
| MSCI Emerging Markets | 7.51% | -61.67% | 2 |
| MSCI Hong Kong | 13.00% | -88.86% | 6 |
Numbers are great for a quick overview. But let's still look at the chart.
Investing benefits from a positive attitude!
The most important stock indices include the largest companies and show the economic strength of individual regions.
All economic regions in the world together have a long-term positive development. That is why we would like to place a special focus on the “MSCI World” index.
It is noteworthy that almost all indices show a positive development. Further aspects on this topic are described in the article «Investing – Mindset».
Comparison of major stock indices
In order to get a good understanding of the long-term development of the stock markets, one must look at the major indices of the world.
Different geographic regions face different problems. The analysis of several decades shows that even wars or major natural disasters have no long-term impact on companies.
Let's look at the individual indices!
MSCI World
Let's start with the global stock market. As a data basis we use the MSCI World. This stock index contains the 1600 largest companies (by market capitalization) from the 23 largest industrialized countries.
In the MSCI World, individual countries are weighted differently depending on their economic performance (as of 2020):
US – 66.31%, Japan - 7,48%, UK – 4.27%, France – 3.34%, Swiss – 3.21% &, Canada – 3.17%, Germany – 2.91%, Australia – 2.11%, Nederland – 1.35%, Hong Kong – 1.02%, Sweden – 1.00%, Denmark – 0.77%, Spain – 0.62%, Italia – 0.60%, Singapore – 0.46%, Finland – 0.32%, Belgium – 0.29%, Ireland – 0.21%, Israel – 0.20%, Norwegian – 0.17%, New Zeeland – 0.10%, Portugal – 0.05%, Austria – 0.05%
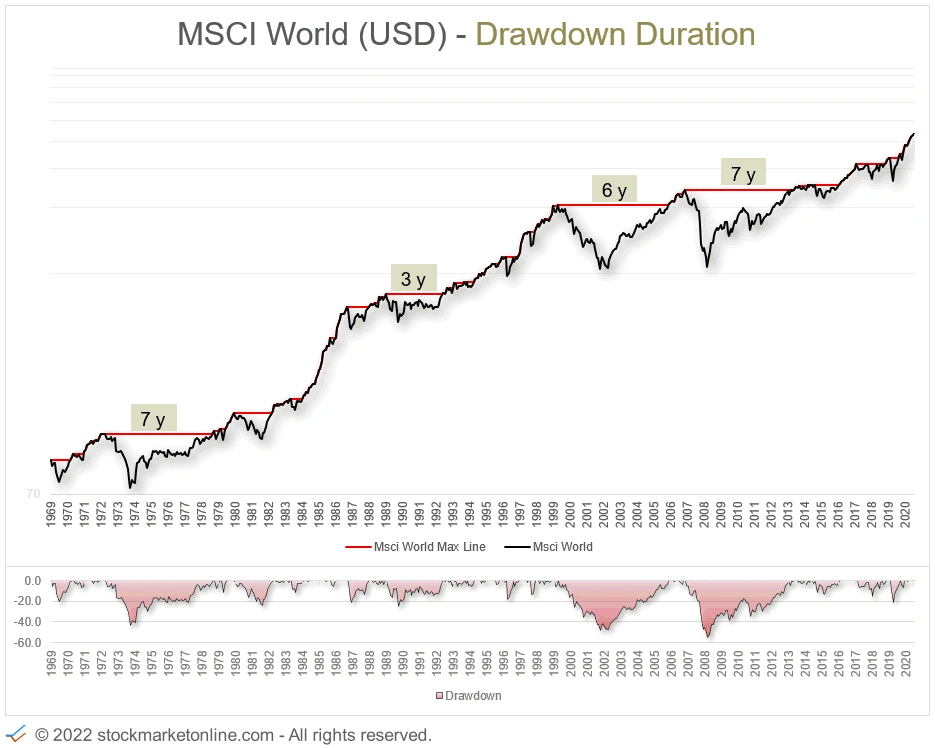
Historical development:
| MSCI World | |
| Annual Return (without dividends) | 5.89% |
| Worst Drawdown | -55.37% |
| Count Drawdowns longer 2 years | 4 |
MSCI World exclude United States
In the above example of the MSCI World, the USA is included with a clear overweight of 69%. Let's look at the same evaluation with the MSCI World without the USA.
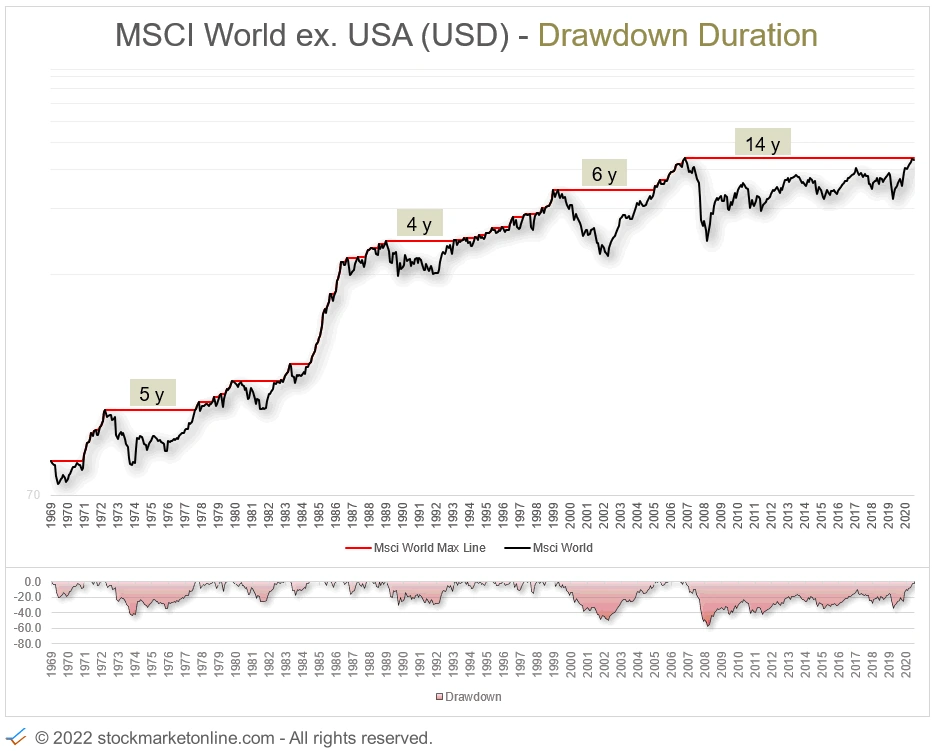
Historical development:
| MSCI World exclude US | |
| Annual Return (without dividends) | 5.89% |
| Worst Drawdown | -58.16% |
| Count Drawdowns longer 2 years | 4 |
The last crisis 7 years ago could not yet be overcome with new highs. This means that the exclusion of the USA has led to this index performing worse than the MCSI World including USA as of 2013.
Conclusion: The USA as the largest economic power in the world should not be missing in a global portfolio.
MSCI North America
North America is the strongest economic region in the world.
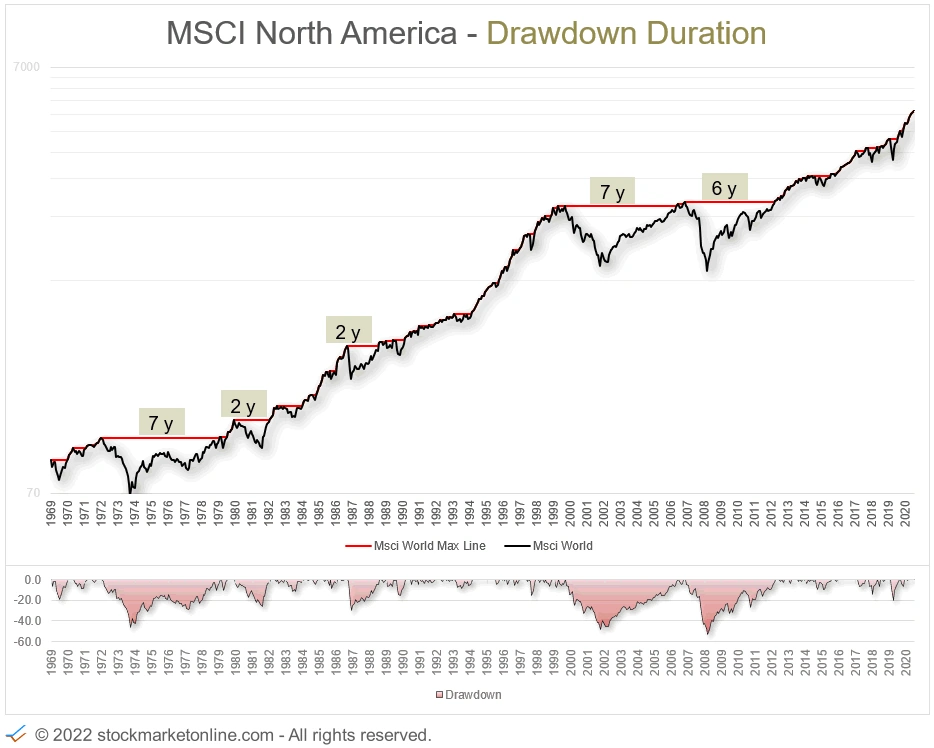
Historical development:
| MSCI North America | |
| Annual Return (without dividends) | 6.65% |
| Worst Drawdown | -52.65% |
| Count Drawdowns longer 2 years | 5 |
The chart speaks for itself. North America has seen a steady increase in value.
MSCI USA
The USA is the largest economic power in the world.
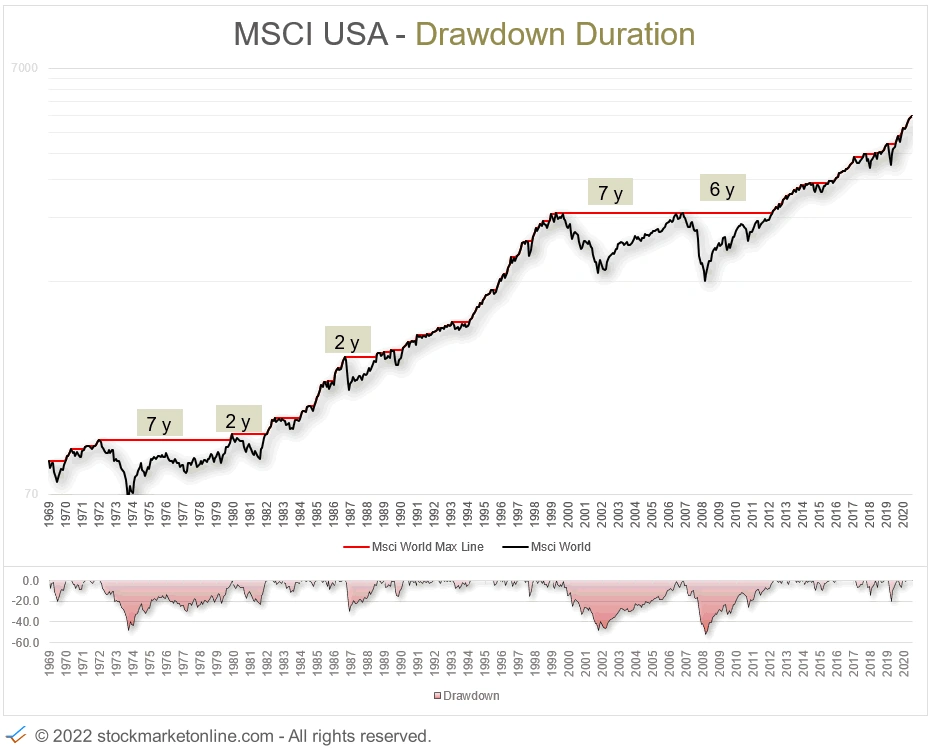
Historical development:
| MSCI USA | |
| Annual Return (without dividends) | 6.57% |
| Worst Drawdown | -52.22% |
| Count Drawdowns longer 2 years | 5 |
The chart speaks for itself. The MSCI USA has seen a steady increase in value.
MSCI Europe
Europe is an important economic region.
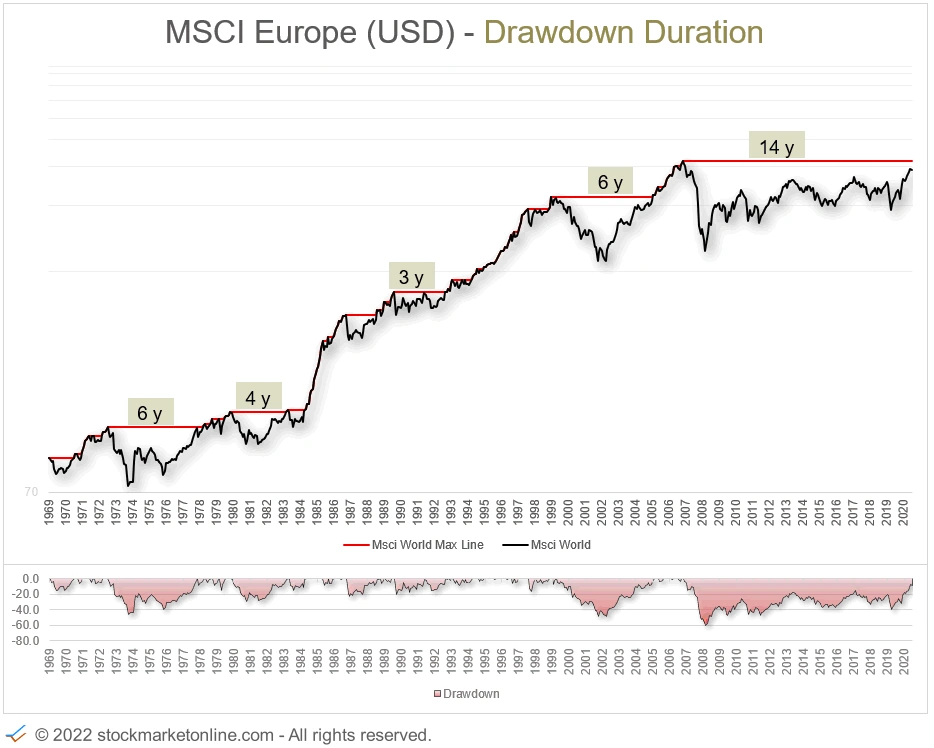
Historical development:
| MSCI Europe | |
| Annual Return (without dividends) | 5.48% |
| Worst Drawdown | -60.90% |
| Count Drawdowns longer 2 years | 5 |
Merging a union of individual countries into a common economic region brings with it challenges. Economically weak regions must be supported by the stronger countries. The overall result is an uneven mix.
The price development of the last 14 years shows a large sideways movement, which indicates a stagnation of economic growth. But this impression is deceptive because individual countries in the euro zone continue to grow.
MSCI Germany
Germany is the economically strongest country in Europe.
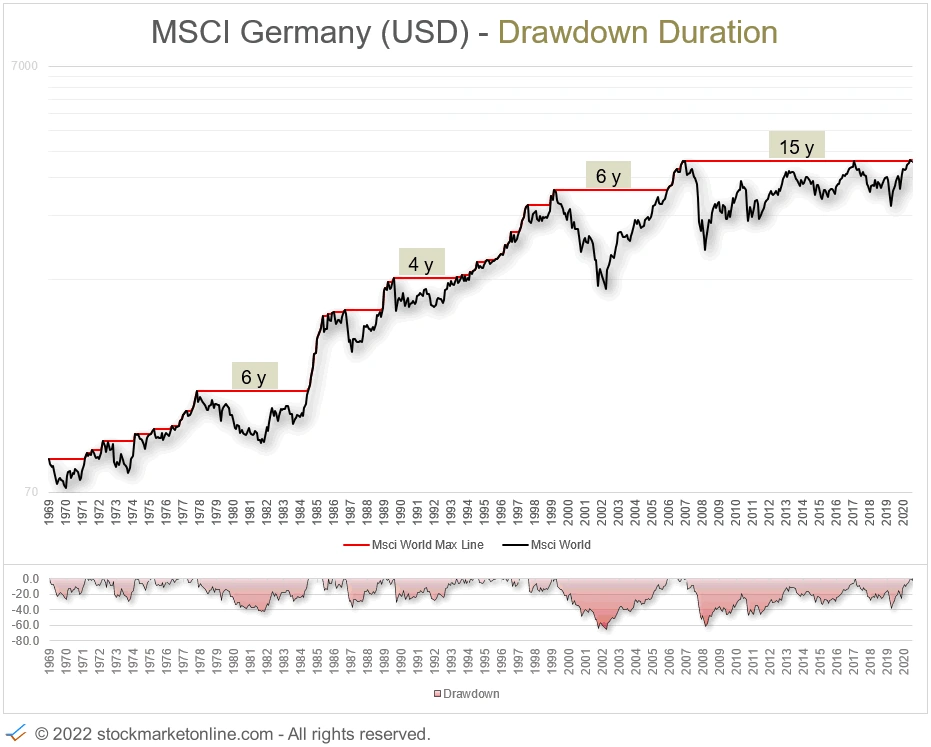
Historical development:
| MSCI Germany | |
| Annual Return (without dividends) | 6.76% |
| Worst Drawdown | -62.52% |
| Count Drawdowns longer 2 years | 4 |
Germany has not yet been able to overcome the last high 15 years ago.
The DAX index is the index of the largest companies in Germany. The DAX has the unique feature that dividends are included in the price development. Our basis for the development of the German economy is the MSCI Germany. The MSCI Germany does not include dividends. This means that the DAX has a different chart than the MSCI Germany. To evaluate all indices equally (without dividends), we use the data of the provider MSCI.
MSCI Swiss
Switzerland is an exotic country in Europe. It is not a member of the European Union.
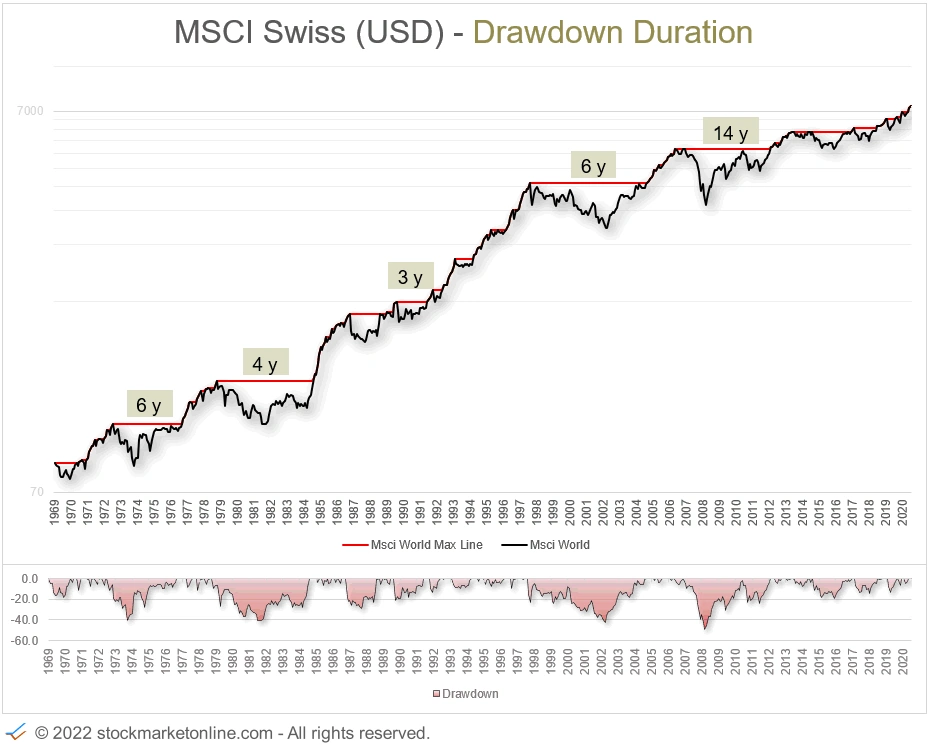
Historical development:
| MSCI Swiss | |
| Annual Return (without dividends) | 8.07% |
| Worst Drawdown | -49.01% |
| Count Drawdowns longer 2 years | 5 |
Switzerland shows an above-average average return.
MSCI Pacific
The MSCI Pacific includes large and mid-cap companies in the Pacific region.
The following countries are represented (as of 07.2021):
Japan – 66.36%, Australia – 20.60%, Hong Kong – 9.23%, Singapore – 3.05%, New Zeeland – 0.68%
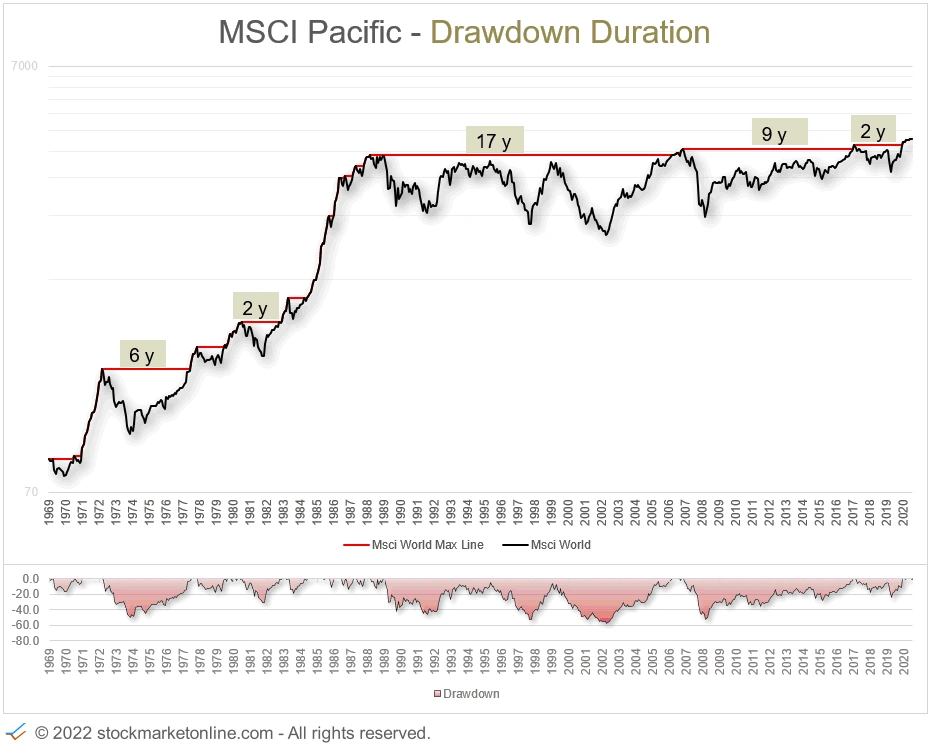
Historical development:
| MSCI Pacific | |
| Annual Return (without dividends) | 6.72% |
| Worst Drawdown | -47.49% |
| Count Drawdowns longer 2 years | 5 |
MSCI Japan
Japan is one of the largest economic powers in the world. In 2021, Japan is ranked third in the world.
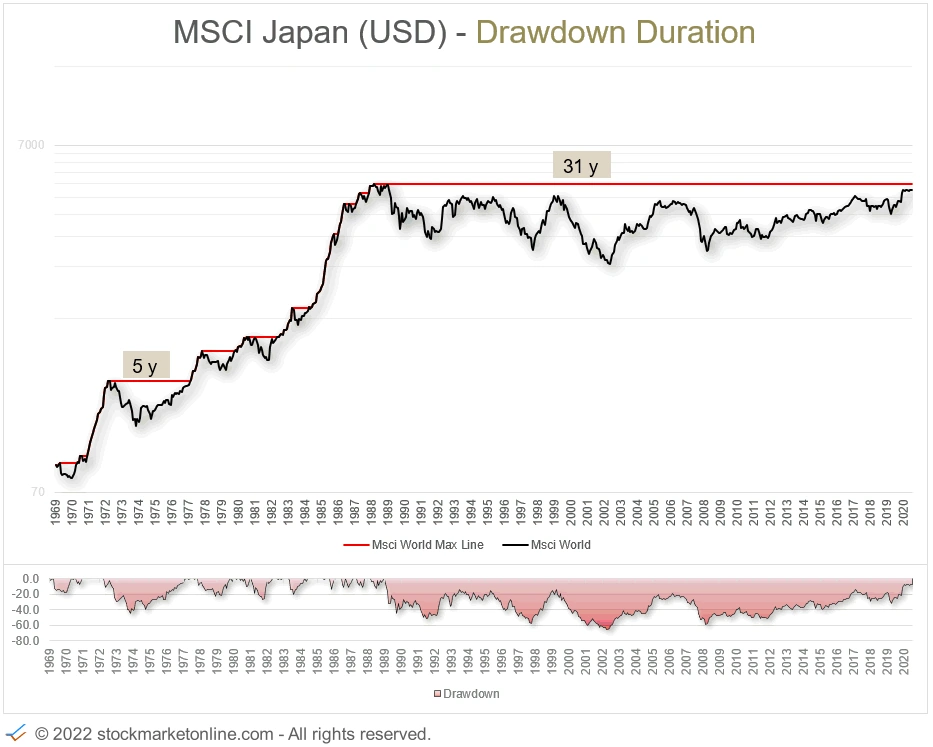
Historical development:
| MSCI Japan | |
| Annual Return (without dividends) | 7.30% |
| Worst Drawdown | -63.36% |
| Count Drawdowns longer 2 years | 2 |
The chart of the MSCI Japan shows a strong correction over the last 30 years. Still, Japan has an average return of over 7% per year. This return results from the extraordinarily strong price increases in the 80s.
At that time, it was believed that Japan would dominate the world economy. The share prices experienced a very pronounced home.
MSCI Emerging Markets
The emerging markets are a significant area of the global economy. China is represented in the MSCI Emerging Markets Index, although China's economic performance means that it can no longer be considered a developing country. Unfortunately, China does not meet MSCI's requirements for a developed country in terms of transparency of economic activities. Thus, China is classified as a developing country by MSCI.
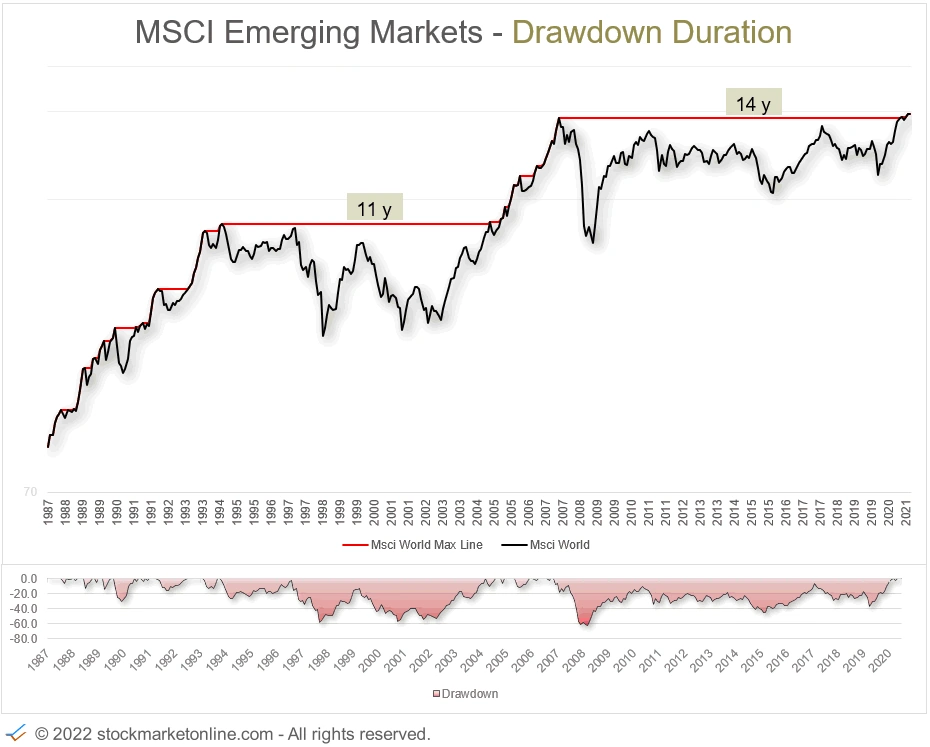
Historical development:
| MSCI Emerging Markets | |
| Annual Return (without dividends) | 7.51% |
| Worst Drawdown | -61.67% |
| Count Drawdowns longer 2 years | 2 |
The chart of the MSCI Japan shows a strong correction over the last 30 years. Still, Japan has an average return of over 7% per year. This return results from the extraordinarily strong price increases in the 80s.
At that time, it was believed that Japan would dominate the world economy. The share prices experienced a very pronounced home.
MSCI Hong Kong
MSCI Hong Kong is used as a symbol of economic development in China.
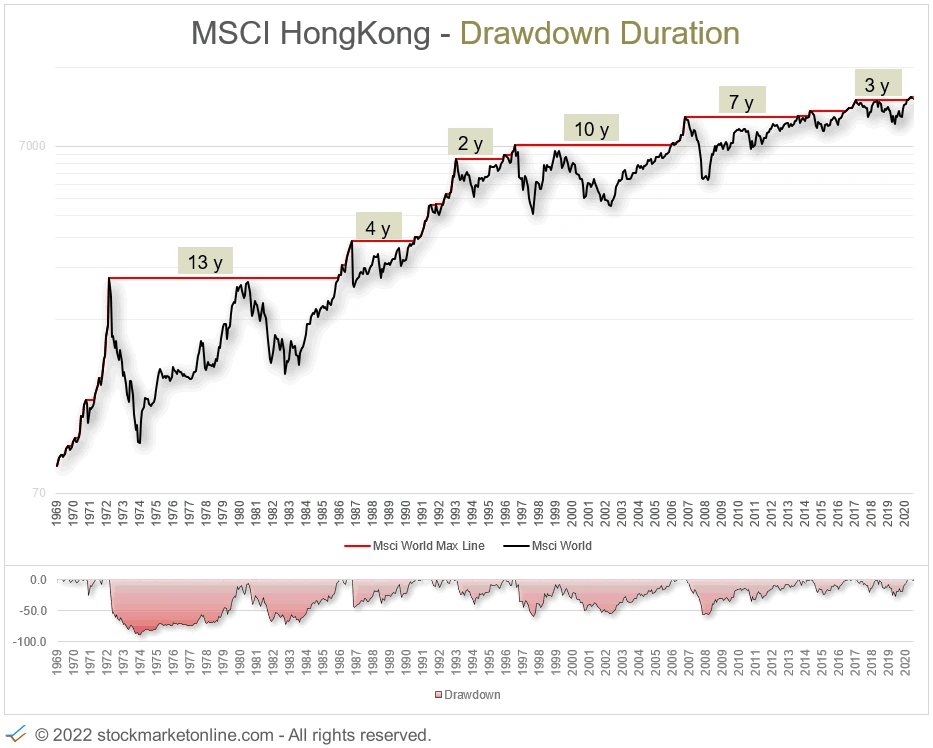
Historical development:
| MSCI Hong Kong | |
| Annual Return (without dividends) | 13.00% |
| Worst Drawdown | -88.86% |
| Count Drawdowns longer 2 years6 |
Summary
The analysis shows that all stock indices have an average performance of 5.5% - 8.0% over the last 50 years.
Share price drops of around -50% were everywhere due to the global crises.
The examples of Japan and Europe show that price declines in individual regions can also take a long time.
We believe that spreading the capital across regions and countries makes the most sense. Individual areas can suffer or gain in the long term because of economic or political events. The strengths and weaknesses of the economic regions will shift repeatedly in the future, as in the past. However, the entire global economy will always develop positively in the long term.
You can calculate the potential of your investment with our free investment calculator.