Profit from Recurring Patterns and Seasonality
Recurring price patterns and seasonality arise from economic and corporate events.
Our platform find the best opportunities and show all relevant details.
Recurring price patterns and seasonality are a very good timing tool.
But why does it work?
What are Recurring Patterns and How do They Arise?
Recurring patterns are price developments that repeat over time. The recurrences over time can occur at different periods and intervals (annually, monthly, weekly, every X years, etc.).
Price developments of stocks, currencies and commodities are the result of economic or corporate developments. The developments repeat themselves and automatically create recurring (seasonal) patterns. Weather-related reasons also influence the demand for commodities or products. And political events move the development of stock prices.
Price developments of stocks, currencies and commodities are the result of economic or corporate developments. The developments repeat themselves and automatically create recurring (seasonal) patterns. Weather-related reasons also influence the demand for commodities or products. And political events move the development of stock prices.
Reasons for recurring patterns
- Economic
- Corporate developments
- Weather
- Political events (elections)

Quality and Practicability of the Strategies
If you as a private trader or investor can only choose a few strategies, the quality of the strategies and the realistic implementation of the strategies is crucial.
Above all, practicality is a decisive factor. Good strategies do not have to be elaborate and complicated.
Recurring patterns are a very good choice.
The quality can be easily checked with our tools.
The practical implementation is usually very simple, because there are fixed entry and exit dates.

Let's look at a some examples
These examples have been known for a long time and are used intensively by experts.
But there are many more good opportunities.
But there are many more good opportunities.
The best-known seasonal pattern in the stock market is:
""Sell in May and go away, but remember to come back in September!""
The following chart shows the different performance of the SP500 over the last 70 years if it had been bought or sold in May.
Prices rise much more from October to April than from May to the end of September.
""Sell in May and go away, but remember to come back in September!""
The following chart shows the different performance of the SP500 over the last 70 years if it had been bought or sold in May.
Prices rise much more from October to April than from May to the end of September.

The recurring strength of precious metals in the early weeks of the year is exceptional.
The chart shows the seasonal performance of gold, silver, copper, palladium and platinum.
These precious metals rise the most in the first weeks of the year compared to the rest of the year.
The chart shows the seasonal performance of gold, silver, copper, palladium and platinum.
These precious metals rise the most in the first weeks of the year compared to the rest of the year.

Election years have a very strong impact on the stock market.
For example, the SP500 has always closed in positive territory in the year before an election.
The year following an election also has a very good hit rate of over 87% in which the SP500 closes the year with a gain.
The worst performance is in the mid-term election year. Those who have to invest in a mid-term election year can optimise their profits by applying the Sell in May rule.

Microsoft's stock usually rises sharply from mid-October to mid-November.
The hit rate is very good. Only in 2003 and 2012 was there a significant loss. In all other years, the share price rose.
On 11 occasions, the share price even rose by more than 10%.
The hit rate is very good. Only in 2003 and 2012 was there a significant loss. In all other years, the share price rose.
On 11 occasions, the share price even rose by more than 10%.

The comparison shows two shares from the healthcare sector and illustrates which share has generated higher profits in the past.
In this example, it is clear that the Eli Lilly share has a better hit rate (over 95%).
Comparisons are an essential part of any analysis.
In this example, it is clear that the Eli Lilly share has a better hit rate (over 95%).
Comparisons are an essential part of any analysis.

There are also seasonal patterns within a month.
The monthly pattern shows that in the second half of the month, the TLT ETF has gained a total of 183.41% over the past 20 years.
This is equivalent to an average annual return of 9.17%.
The monthly pattern shows that in the second half of the month, the TLT ETF has gained a total of 183.41% over the past 20 years.
This is equivalent to an average annual return of 9.17%.

Use our Seasonality Screener to automatically identify strong trading and investment signals!
The screener offers numerous filters that you can customise to suit your needs.
Get the best entry and exit signals with just a few clicks.
The screener offers numerous filters that you can customise to suit your needs.
Get the best entry and exit signals with just a few clicks.

The screener shows you the results separately for stocks, ETFs, indices, currencies and futures.
This gives you a clear overview and allows you to focus on your preferred asset class.
This gives you a clear overview and allows you to focus on your preferred asset class.
The statistical evaluations help you to optimize the time period of the analysis and to improve the quality of the analysis.

The statistics show the price development, in the analyzed years, months, days of the month and days of the week.
This data helps to identify good recurring price patterns.
This data helps to identify good recurring price patterns.
The Seasonality Comparison tool is very useful for comparing different instruments.
You can easily identify which index, sector, asset class, currency or commodity has performed best or worst.
You can easily identify which index, sector, asset class, currency or commodity has performed best or worst.

We show the seasonality, performance, and hit ratio of each instrument.
But There's a Problem
How to find the best investment and trading opportunities?
Our Screener Finds The Best Opportunities!
There are hundreds of very good entry and exit times stored in our database.
What is crucial for success?
All investors and traders who successfully implement strategies with a set of rules have different strategies in use.
There is no one ultimate strategy. The mix is the basis for success.
The number of strategies varies greatly. Institutional investors sometimes have several hundred strategies in use. Private investors usually have between 2 and 10 different strategies.

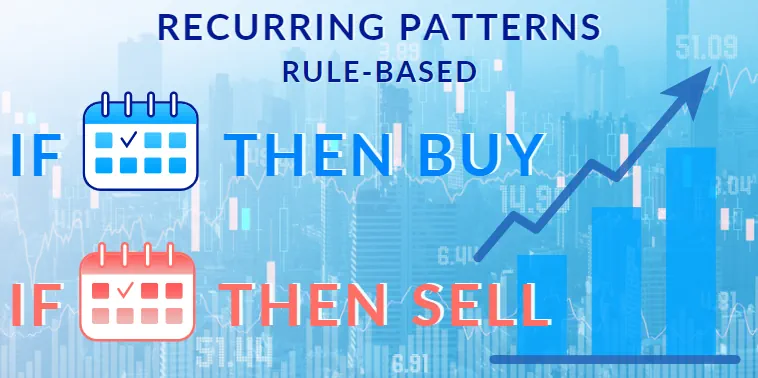
Timing is King
One solution is seasonality!
- Seasonality analyzes and shows entry and exit times.
Good Analysis Requires Powerful Tools.
To extract the right information from the data, we offer professional analytics tools.
Why you should Analyze the Market More!
- Analysis shows investment and trading opportunities.
- Analysis generates higher profits in trading and investing.
The analyses show the historically best investment and trading opportunities with high hit rates and optimized timing for entries and exits.
Higher Profits in Less Time
With recurring patterns, you'll make the gains in a few weeks that take other strategies a year to achieve.
Investing only in the strongest times increases your chances of success.
Investing only in the strongest times increases your chances of success.
Would You Like to Know which Stocks You should Buy Now?
Our screening algorithm shows you the historically best time to buy and sell.

All markets (stocks, currencies, commodities, bonds, and crypto) have a lot of recurring price patterns at different times.
Hundreds of very good entry and exit times are stored in our database for you.
Finding good entry and exit points has never been easier.
Start Your Free Trial Now
Identifying trading & investing opportunities has never been easier.
Find the best time to buy or sell with a few clicks!
Find the best time to buy or sell with a few clicks!
Make use of our risk-free trial.