December 06, 2025 a 11:44 am
SWKS: Fibonacci Analysis - Skyworks Solutions, Inc.
Skyworks Solutions, Inc. is demonstrating a bearish trend in its stock price over the examined period. Known for its innovations in the semiconductor industry, its stock has experienced substantial downward pressure recently. As a leader in delivering connectivity solutions, the company's diverse customer base and market reach are pivotal strengths, though current market conditions pose challenges. A strategic focus on new product lines and market expansion may offer potential recovery opportunities.
Fibonacci Analysis
| Indicator | Details |
|---|---|
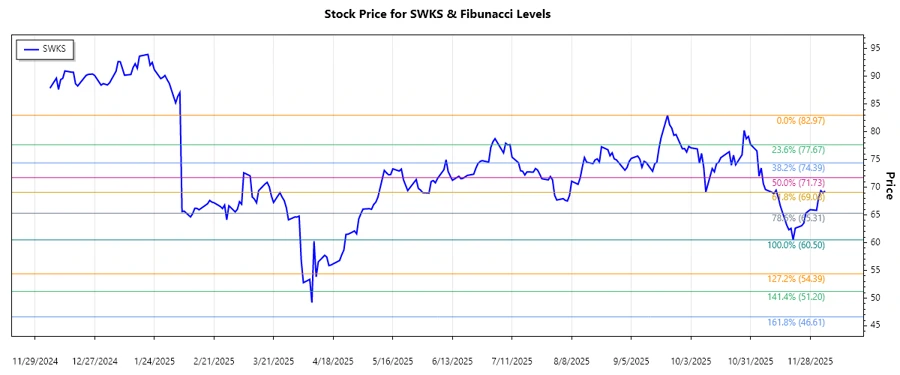
| Trend Start Date | 2025-09-22 |
| Trend End Date | 2025-12-05 |
| High Price & Date | $82.97 on 2025-09-22 |
| Low Price & Date | $60.5 on 2025-11-20 |
Fibonacci Retracement Levels
| Level | Price |
|---|---|
| 0.236 | $67.94 |
| 0.382 | $71.52 |
| 0.5 | $76.74 |
| 0.618 | $74.33 |
| 0.786 | $77.31 |
The current price of $69.32 is trading above the 0.236 retracement level, indicating a slight recovery. However, it still remains below 0.382, suggesting resistance ahead.
Technically, the stock exhibits potential resistance levels near the 0.382 retracement, indicating difficulty in breaking above $71.52. Sustained support above the 0.236 level could signal a future bullish trend reversal.
Conclusion
In conclusion, Skyworks Solutions, Inc. stock has faced significant downward trends in recent months. Market conditions and competitive pressures challenge its current trajectory. Nonetheless, its robust product portfolio offers recovery opportunities, contingent on strategic redirection and external market conditions. The stock evidences potential short-term resistance at the 0.382 Fibonacci level, implying caution in bullish positioning. Analysts might consider potential buying opportunities if support levels maintain, with an eye on broader market indicators. Overall, investors should remain vigilant of market shifts impacting semiconductor demand.