December 07, 2025 a 06:44 am

PPL: Fibonacci Analysis - PPL Corporation
PPL Corporation, a key utility provider in the US and UK, has shown market resilience in recent months despite fluctuations in energy demand and regulatory challenges. Their diversified energy production portfolio supports a stable income flow, crucial for maintaining dividend reliability. Given the recent market movements, the stock provides potential opportunities for strategic investments.
Fibonacci Analysis
| Detail | Value |
|---|---|
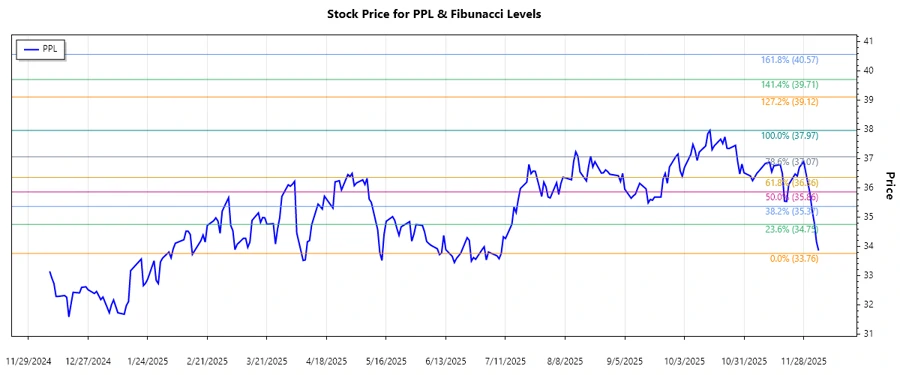
| Start Date | 2025-07-09 |
| End Date | 2025-12-05 |
| High Point | 37.97 (2025-10-15) |
| Low Point | 33.76 (2025-07-09) |
| Fibonacci 0.236 | $34.73 |
| Fibonacci 0.382 | $35.31 |
| Fibonacci 0.5 | $35.87 |
| Fibonacci 0.618 | $36.43 |
| Fibonacci 0.786 | $37.19 |
| Current Retracement Zone | 0.786 |
| Technical Interpretation | The current price resides in the 0.786 retracement zone, suggesting a strong resistance level around $37.19, with potential for bearish movement if the level is not breached. |
Conclusion
The PPL Corporation has exhibited a strong bullish trend over the past few months, reflecting investor confidence in its robust earnings due to a diversified energy portfolio. While the current price is near a significant resistance level at the 0.786 Fibonacci retracement, a breach could confirm continued upward momentum. However, failure to break this level could necessitate a reevaluation of short-term bullish positions. Market sentiment remains cautiously optimistic, balancing potential energy regulation impacts and the promising financial outlook of PPL's operations. Long-term investors may find substantial value, albeit with careful monitoring of regulatory environments and market dynamics.