December 06, 2025 a 06:44 am
ORLY: Fibonacci Analysis - O'Reilly Automotive, Inc.
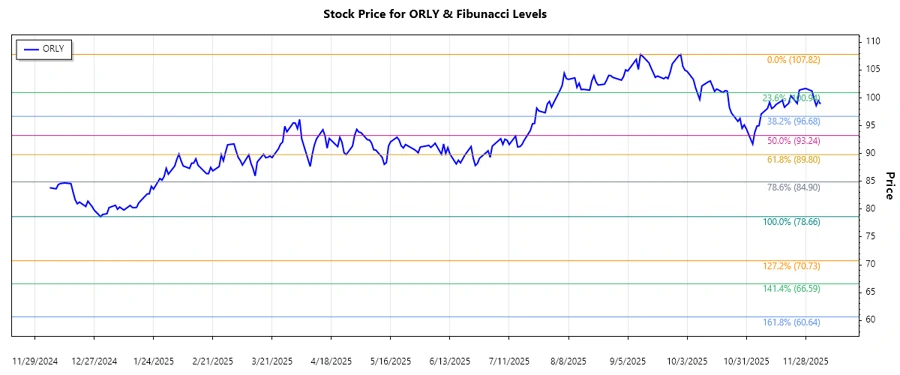
The stock of O'Reilly Automotive, Inc. (ORLY) has exhibited a notable downtrend over the recent months, possibly due to macroeconomic pressures and operational challenges. Despite being a leader in the automotive aftermarket retail sector, the firm's stock has not been immune to broader market volatilities. Analyzing recent technical patterns can offer insights into potential turnaround points or continued bearish trends.
Fibonacci Analysis
| Aspect | Details |
|---|---|
| Trend Start Date | 2024-12-06 |
| Trend End Date | 2025-12-05 |
| High (Price & Date) | $107.82 on 2025-09-11 |
| Low (Price & Date) | $78.66 on 2024-12-30 |
| Fibonacci Levels |
0.236: $86.63 0.382: $90.45 0.5: $93.24 0.618: $96.03 0.786: $100.36 |
| Current Price | $98.89 |
| Retracement Zone | 0.618 - The current price is close to this level. |
The current price is situated around the 0.618 Fibonacci retracement level, which is often indicative of potential support. If the stock holds above this level, it may suggest a possible trend reversal. Conversely, if it falls below, the bearish trend might continue. This level becomes crucial for future technical assessments, acting as a key battleground between buyers and sellers.
Conclusion
O'Reilly Automotive's recent downtrend in its stock price reflects underlying challenges despite its strong market position. The 0.618 Fibonacci level at $96.03 serves as a critical juncture. A breach above this position could signal bullish recovery opportunities, while failure to hold could imply sustained bearish pressure. Investors must weigh global economic conditions, sector performance, and internal corporate developments in their decision-making. The chart's current configuration suggests cautious optimism, with much depending on upcoming market trends and the company's operational adjustments.