May 24, 2026 a 03:15 pm
MOS: Fibonacci Analysis - The Mosaic Company
The Mosaic Company, a leading producer and marketer of concentrated phosphate and potash crop nutrients, has recently shown significant market activity. The stock has experienced volatile price movements in recent months. These fluctuations are crucial for traders looking for potential entry and exit points based on Fibonacci retracement levels.
Fibonacci Analysis
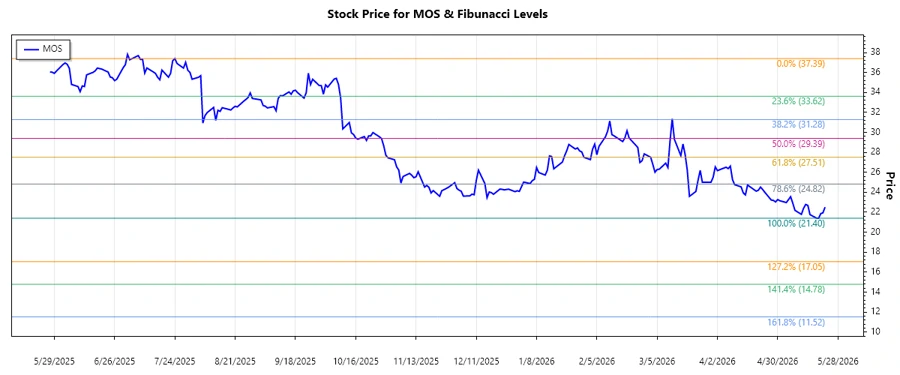
In recent months, The Mosaic Company (MOS) stock has predominantly been in a downtrend. Using the data provided, we calculate key Fibonacci retracement levels as potential support and resistance areas.
| Details | Information |
|---|---|
| Trend Start Date | 2025-07-24 |
| Trend End Date | 2026-05-22 |
| High Point | $37.39 (2025-07-24) |
| Low Point | $21.40 (2026-05-19) |
| Fibonacci Levels |
|
| Current Price | $22.51 |
| Current Retracement | None |
| Technical Interpretation | The current price is below the 0.236 Fibonacci retracement level, indicating further downside potential before finding support. |
Conclusion
The Mosaic Company has experienced a prolonged downtrend, identified by technical analysis. The current price remains below key Fibonacci retracement levels, indicating pending potential recovery. As a market leader in crop nutrients, any positive shifts in market sentiment or production improvements could trigger an upward movement towards the identified retracement levels. Investors should consider external factors, including agricultural demands and fiscal reports, that may impact the stock's volatility and direction. While there are opportunities for gains, risks associated with continued price decreases remain.
Smart Data Insight
Master the Perfect Entry & Exit for this Stock
Don't leave your profits to chance. Historically, this stock follows specific seasonal patterns that institutional traders use to maximize returns.
- ✅ Identify the "Golden Buying Window"
- ✅ Avoid high-risk correction cycles
- ✅ Backtested data from the last 20+ years