March 22, 2026 a 03:43 pm
HOOD: Fundamental Ratio Analysis - Robinhood Markets, Inc.
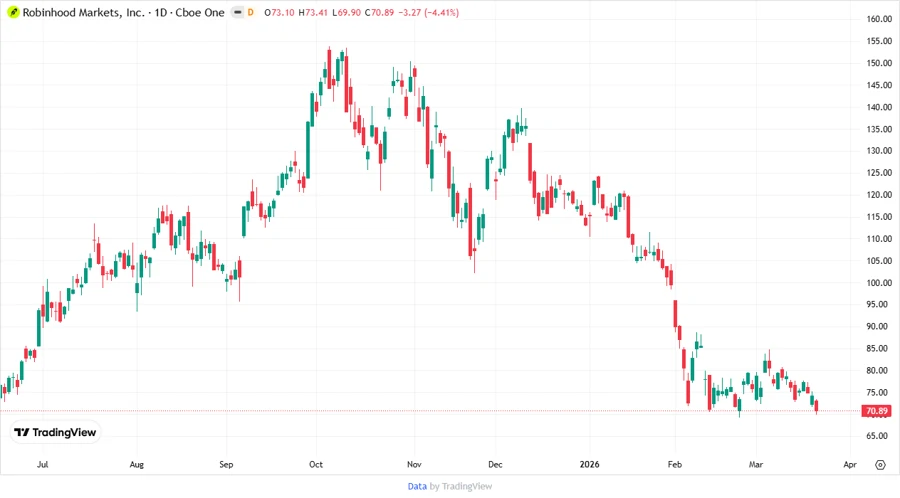
The Robinhood Markets, Inc. stock reflects a dynamic player in the financial services industry, catering primarily to retail investors in the United States. With a focus on democratizing finance, Robinhood offers a broad spectrum of products from stocks to cryptocurrencies. However, the company's journey is fraught with challenges amidst market fluctuations and the fintech sector's evolving landscape.
Fundamentals Rating
Robinhood Markets, Inc. presents mixed fundamental scores, highlighting potential areas of improvement and strengths within their operations.
| Category | Score | Visualization |
|---|---|---|
| Overall | C+ | |
| Discounted Cash Flow | 1 | |
| Return on Equity | 5 | |
| Return on Assets | 4 | |
| Debt to Equity | 1 | |
| Price to Earnings | 1 | |
| Price to Book | 1 |
Historical Rating
Review of historical scores indicates recent improvements in Robinhood's comprehensive financial indicators.
| Date | Overall | DCF | ROE | ROA | Debt/Equity | P/E | P/B |
|---|---|---|---|---|---|---|---|
| 2026-03-20 | 2 | 1 | 5 | 4 | 1 | 1 | 1 |
| N/A | 0 | 1 | 5 | 4 | 1 | 1 | 1 |
Analyst Price Targets
Analysts provide a range of price targets for Robinhood Markets, Inc., indicating positive prospects with a consensus leaning towards a 'Buy'.
| High | Low | Median | Consensus |
|---|---|---|---|
| 170 | 100 | 125 | 130.27 |
Analyst Sentiment
The sentiment among analysts shows a dominant 'Buy' recommendation, supporting a favorable outlook for Robinhood.
| Recommendation | Count | Visualization |
|---|---|---|
| Strong Buy | 0 | |
| Buy | 16 | |
| Hold | 5 | |
| Sell | 2 | |
| Strong Sell | 0 |
Conclusion
Robinhood Markets, Inc. continues to leverage its innovative platform to capture market share, backed by solid analyst support and an optimistic price outlook. However, its financial fundamentals suggest areas for operational improvements to enhance profitability. While the company's focus on growth opportunities is commendable, it must navigate regulatory and competitive challenges effectively. Investors could see potential gains if Robinhood addresses these risks while maintaining its innovative edge.
Smart Data Insight
Master the Perfect Entry & Exit for this Stock
Don't leave your profits to chance. Historically, this stock follows specific seasonal patterns that institutional traders use to maximize returns.
- ✅ Identify the "Golden Buying Window"
- ✅ Avoid high-risk correction cycles
- ✅ Backtested data from the last 20+ years