April 07, 2026 a 11:43 am

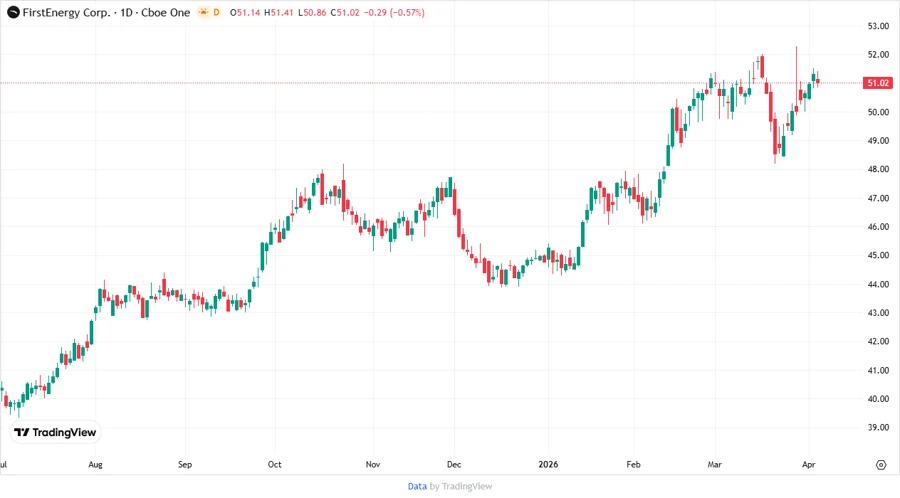
FE: Fundamental Ratio Analysis - FirstEnergy Corp.
FirstEnergy Corp. operates one of the most diversified electricity generation portfolios in the United States, utilizing coal, nuclear, hydroelectric, natural gas, wind, and solar power. Although it maintains a stable customer base across six states, its financial performance shows modest growth potential as indicated by the fundamentals. The company is deeply embedded in the regulated electric industry.
Fundamental Rating
FirstEnergy's fundamental analysis reveals potential for steady, if unspectacular, performance. Key metrics are moderate, reflecting a balanced financial stance with certain areas needing improvement.
| Category | Score | Visual |
|---|---|---|
| Overall | C+ | |
| Discounted Cash Flow | 1 | |
| Return on Equity | 2 | |
| Return on Assets | 4 | |
| Debt to Equity | 1 | |
| Price to Earnings | 2 | |
| Price to Book | 2 |
Historical Rating
Comparing historical scores emphasizes consistency, with slight advancement in overall performance, suggesting cautious optimism.
| Date | Overall | DCF | ROE | ROA | D/E | P/E | P/B |
|---|---|---|---|---|---|---|---|
| 2026-04-06 | 2 | 1 | 2 | 4 | 1 | 2 | 2 |
| Previous | 0 | 1 | 2 | 4 | 1 | 2 | 2 |
Analyst Price Targets
The analyst forecasts maintain a stable perspective on FirstEnergy, with limited upside or downside, advocating a hold strategy.
| High | Low | Median | Consensus |
|---|---|---|---|
| $56 | $46 | $50 | $50.5 |
Analyst Sentiment
Consensus among analysts indicates a general inclination towards holding the stock, with an absence of strong buy or sell recommendations.
| Recommendation | Number | Visual |
|---|---|---|
| Strong Buy | 0 | |
| Buy | 11 | |
| Hold | 16 | |
| Sell | 0 | |
| Strong Sell | 0 |
Conclusion
FirstEnergy Corp. presents an opportunity for stable investment, with its diverse energy generation and distribution network. While its financial metrics reflect modest growth, the consistent historical stability suggests minimized risks. However, limited growth potential and current valuations imply cautious optimism for new investors. The market sentiment supports maintaining current positions, with analysts advocating a hold strategy.
Smart Data Insight
Master the Perfect Entry & Exit for this Stock
Don't leave your profits to chance. Historically, this stock follows specific seasonal patterns that institutional traders use to maximize returns.
- ✅ Identify the "Golden Buying Window"
- ✅ Avoid high-risk correction cycles
- ✅ Backtested data from the last 20+ years