May 24, 2026 a 11:44 am
FAST: Fibonacci Analysis - Fastenal Company
The Fastenal Company has been a major player in the industrial and construction supplies distribution market. Recently, the stock displayed a considerable downtrend, with price fluctuations reflecting broader market volatility. However, with its strong distribution network and diverse market presence, Fastenal holds a potential for upside potential if market conditions stabilize. The recent analysis focuses on the technical retracement levels that show where the stock might find support or resistance.
Fibonacci Analysis
| Detail | Information |
|---|---|
| Start Date | 2025-09-30 |
| End Date | 2026-05-22 |
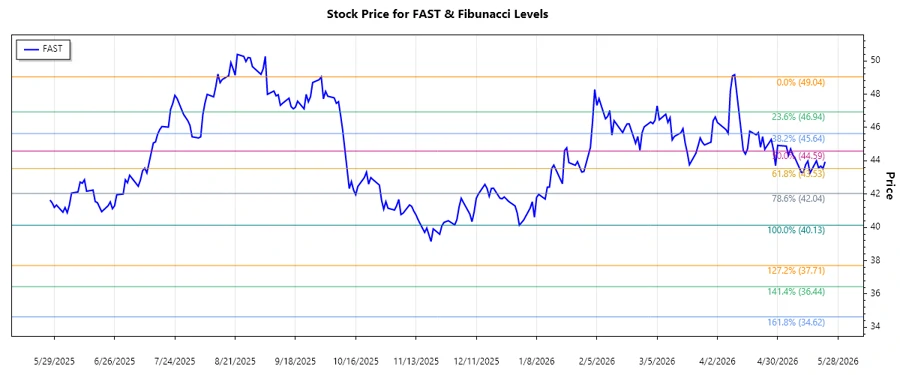
| High (Price & Date) | 49.04 on 2025-09-30 |
| Low (Price & Date) | 40.13 on 2025-12-31 |
| Fibonacci Levels |
|
| Current Price Analysis | Current price $43.94 is between 0.236 and 0.382 Fibonacci levels. |
| Technical Interpretation | The current price is in the retracement zone between 0.236 and 0.382 which may act as a potential support level. |
Conclusion
The Fastenal Company stock indicates a technical retracement phase, providing an opportunity for potential support around the 0.236 to 0.382 levels. However, with the stock positioned within a broader downtrend, investors should be cautious of resistance at higher Fibonacci levels. The broader economic indicators and industry performance will significantly influence future price movement. Given the company's strong market presence, an upside potential exists in stable or improving market conditions, but risks remain in a volatile environment.
Smart Data Insight
Master the Perfect Entry & Exit for this Stock
Don't leave your profits to chance. Historically, this stock follows specific seasonal patterns that institutional traders use to maximize returns.
- ✅ Identify the "Golden Buying Window"
- ✅ Avoid high-risk correction cycles
- ✅ Backtested data from the last 20+ years